
Wind turbine blades: Big and getting bigger
Two decades of technical and market development has made this once marginal application a global giant and one of the world’s largest markets for composites.


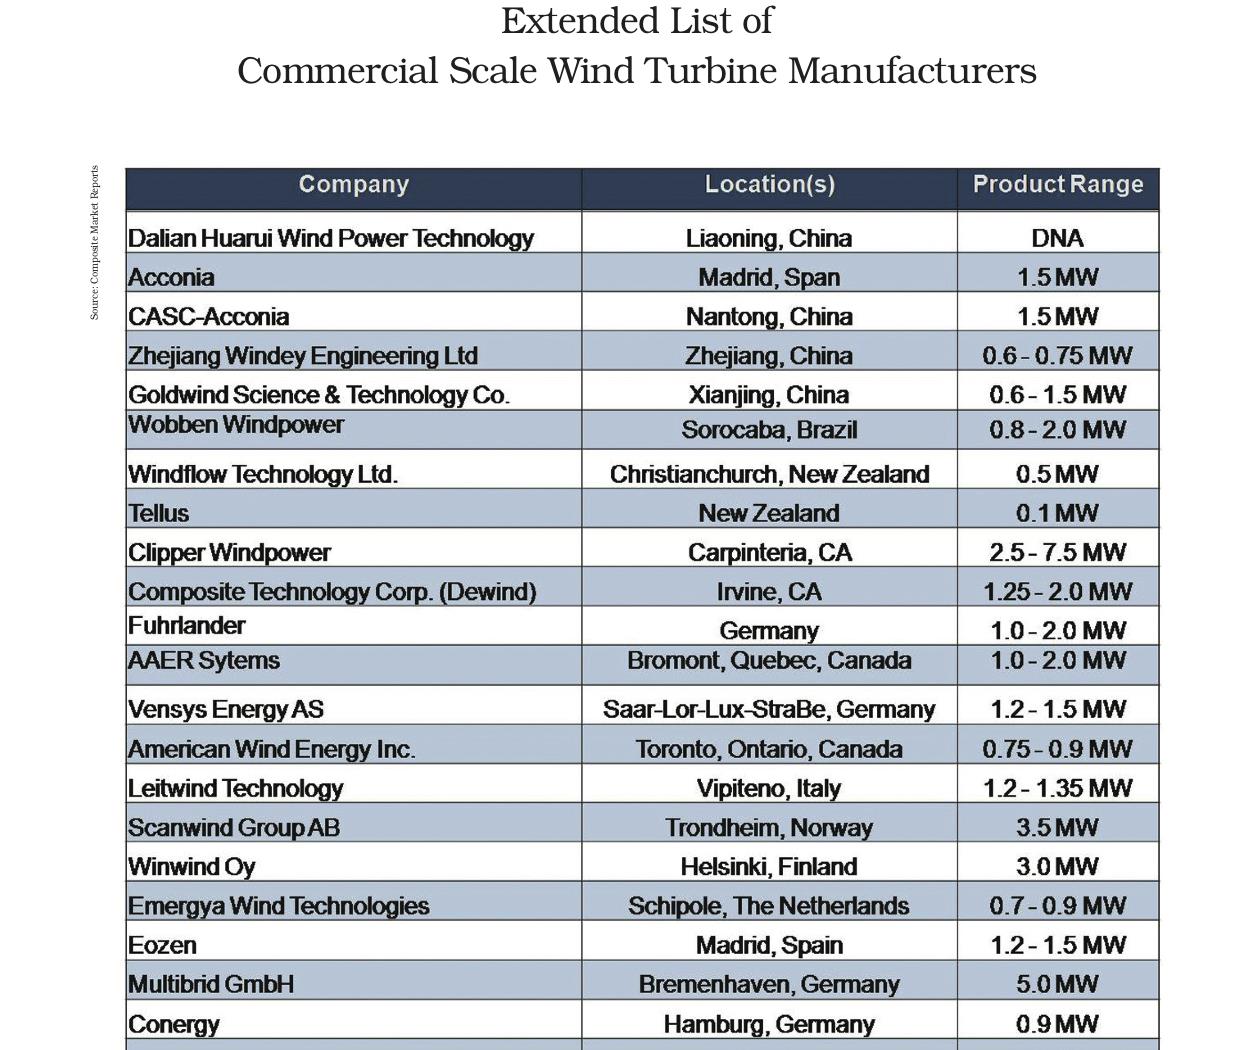
Commercial-scale Wind Turbine Manufacturers
Over the past two decades, the wind turbine industry has dramatically transformed the scale of its offerings to meet the needs of the market. Source: Composite Market Reports
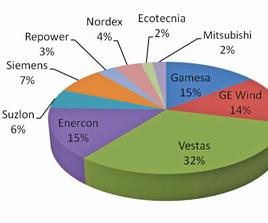
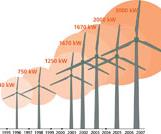
Fig. 1: Cumulative Wind Energy Market Share, 2007
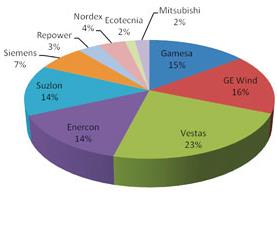
Fig. 2: Top 10 Wind Turbine Manufacturers 2007 Market Share
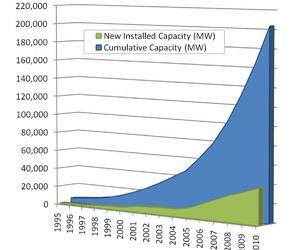
Fig. 3: New Installed Wind Energy Capacity 2005-2010 Source: Composite Market Reports

Fig.4: Global Demand Forecast for Wind Energy Turbines, 2005-2017
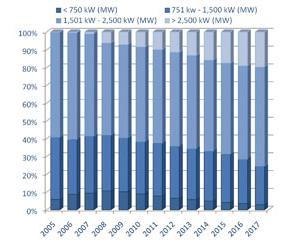
Fig. 5: Trend in New Turbine Unit Production by Turbine Size Class (percent of unit deliveries)
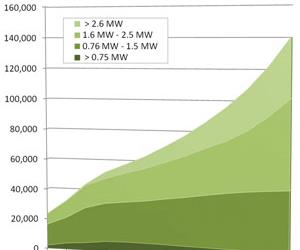
Fig. 6: Estimated Composite Wind Turbine Blade Unit Production, 2005-2017
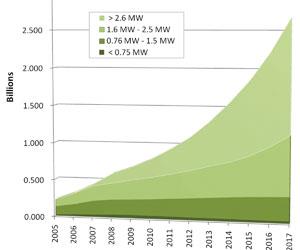
Fig. 7: Forecasted Global Composite Rotor Blade Shipments, 2008-2017 (figures in pounds)
By all accounts, 2007 was another banner year for the wind energy industry. According to estimates compiled by the various associations that now monitor this industry, wind turbine technology added approximately 20 gigawatts (GW) — or 20,000 megawatts (MW) — of new installed generating capacity to power grids around the world last year. Based on the average rated power-generating capacity of turbines, this new growth involved the construction and installation of more than 15,100 new wind turbines — a 28 percent increase over reported 2006 levels. As a result, figures for cumulative global wind energy capacity now are said to range between 95 GW to a little over 100 GW. That’s enough electricity to send Marty McFly’s plutonium-powered DeLorean sports car Back to the Future about 83 times! Based on strong orders, manufacturing capacity buildup and the ever-improving business case for wind power, it is predicted that the industry has the potential to add as much as 30,000 MW of new capacity this year.
Expectations for the near term are high. Steve Sawyer, chief executive of the Global Wind Energy Council (GWEC), opened the recent European Wind Energy Conference (EWEC, Brussels, Belgium) with an encour-aging presentation of the organization’s latest industry report, Global Wind Energy Report 2007. “Due above all to the stronger-than-anticipated growth in the U.S. and China in recent years,” Sawyer observed, “there has been an unexpectedly strong increase in wind deployment all around the world.” The U.S., in fact, led the world with the most new installed wind energy capacity, erecting turbines rated at a total of 5,365 MW last year — more than double the previous year’s record-breaking performance. “As a result,” says Sawyer, “GWEC now foresees the global wind power market growing by over 155 percent to reach 240 GW of total installed capacity by 2012.” To meet near-term needs, the major wind turbine manufacturers across the globe are rapidly expanding and adding new manufacturing facilities (see “Blade Manufacturers Expand to Meet Demand,” under "Editor's Picks," at right, or see the sidebar that appears at the end of this article, below).


At the same event, Birger T. Madsen, from BTM Consult ApS (Rinkøbing, Denmark), said his company forecasts that cumulative installed capacity will reach nearly 1,000 GW — almost 1 million MW — by 2020. That capacity, he contended, “will enable wind power to provide 7 to 8 percent of the world’s electricity demand by 2020.” These statistics for cumulative and new installed generating capacity do a very good job of capturing the excitement surrounding wind energy. A five-year growth target of 155 percent is phenomenal in any business. Over the past two years, wind turbine and blade output have more than doubled and could do so again by the end of the decade.
Bigger picture, better perspective
Our own accounting of the market, however, indicates that these figures and the predictions based on them, as optimistic as they may sound, are probably too conservative. Most of the published figures, to date, are extrapolated from the production statistics of the 10 or so largest wind turbine producers. In Figs. 1 and 2 (at right), the output from the Top 10 turbine suppliers makes up more than 95 percent of cumulative capacity and 99 percent of new installed capacity in the commonly cited industry statistics. During our independent research for this article, we found that at least 30 other active turbine manufacturers delivered turbines last year (see “Extended List of ....” at top right). While most of the 30 are still relatively small, as a group their 2007 output was more than double that of 2006, and many are expanding or have announced large future expansions: Acconia (Madrid, Spain) delivered about 760 MW of turbines to the Spanish and Chinese during 2007, with major market growth planned for the U.S. market this year. China’s leading domestic turbine company, Goldwind Science and Technology Co. (Xinjiang, China), delivered 867 MW of wind turbines last year. By way of comparison, these two companies each added more generating capacity than Top 10 providers REpower (Hamburg, Germany), Nordex AG (Rostock, Germany), Alstom Ecotecnia (Barcelona, Spain) and Mitsubishi Power Systems (Lake Mary, Fla.). In the U.S., Clipper Windpower (Carpinteria, Calif.) delivered only a few of its 2.5-MW Liberty systems last year but has order backlogs to support raising output to several hundred a year, beginning this year. Composite Technology Corp. (Irvine, Calif.), which purchased the turbine manufacturer DeWind (Lübeck, Germany) through EU Energy Plc in the summer of 2006, also will see a significant ramp-up in deliveries, starting this year.
Together, these 30 other producers delivered approximately 3,325 MW of capacity last year, an additional 15 percent not accounted for in the published estimates previously noted but far too significant to ignore.
Better data, bigger output
Therefore, on the basis of year-end results from the entire list of 40 manufacturers and our tracking of new wind turbine construction in more than 40 different countries, we have revised the numbers. It appears that in 2007 the worldwide wind energy industry produced not 20,000 MW of new power, but rather 23,100 MW. While a difference of 3,100 MW may not seem like much, if we consider that the wind turbines delivered last year averaged 1.39 MW in size, we can come up with a more meaningful figure for the difference — roughly 2,000 turbines. Because nearly all of these turbines are horizontal axis, three-blade systems, that comes to 6,000 blades, representing, again in rough terms, an additional 50 million lb (22,680 metric tonnes) of composites! Based on our accounting of actual production output, the figure for new turbine production in 2007 also must be revised upward to 17,489 turbines. Similarly, we’ve revised upward the figure for 2006 to about 15,100 turbines — the figure for 2007 that was previously noted in the introduction — and about 11,150 units in 2005. Assuming three-blade systems, we can say that more than 43,500 composite wind turbine blades were built last year.
To better gauge the impact of the wind energy industry on the composites industry’s manufacturing and supply base, it has been necessary to make a detailed accounting of cumulative capacity, new installations, order backlogs, buying trends, electrical generation costs, and a number of other factors. Based on the results, our outlook is somewhat more optimistic than that offered by the respected GWEC and BTM Consult (see Fig. 4, at right). Our optimism is based, in part, on the demonstrated ability of wind turbine companies, as a group, to consistently exceed others’ forecasted expectations. Further, the growing costs and potential liabilities of traditional fuel sources compared to wind (we forecast that the latter will remain cost-free for at least the next 10 years) are improving the economics of developing large-scale wind farms. Further, the significant potential for new emissions taxes, fees, “cap and trade” systems and other legislative proposals, like those being proposed in the EU, could make wind farms the least costly source of electricity in many parts of the world. Even without this potential boost, it is easy to predict that media headlines will continue to read “Record Year Output in Wind Energy” for the next two decades.
Taking these additional factors into account, new installed wind energy-generating capacity, measured in megawatts, is poised to grow at an average annual rate of 19 percent over the next decade. Consequently, GWEC’s predicted capacity of 240 GW in 2012 will be reached about a year-and-a-half earlier. Similarly, BTM Consult predicts that global capacity will reach 1,000 GW by 2020, but our forecast sees that target reached almost two years earlier. Based on this, the total demand for new wind turbines between 2008 and 2017 should exceed 650,000 MW.
Bigger gains, better record
For those who might criticize this outlook as overly optimistic, we acknowledge that, while forecasts for double-digit growth over the next decade-and-a-half spell big opportunities for competing companies, they also bring with them the major challenges associated with managing rapid growth and adjusting capacity to suit the evolving needs of the market (for example, see “Suzlon Blade Recall” news item in this issue). In addition, there may be some “hiccups” regionally. For example, the bullish U.S. market is expecting strong results — similar to last year — but the Production Tax Credit, which subsidizes the industry, is set to expire at the end of this year. If it is not renewed, the U.S. wind energy market could stall in 2009.
However, this is an industry with a proven track record, having increased annual production output by a factor of 15 times over the past 10 years. Of the past 15 years, the wind energy industry recorded an increase in its annual production output of less than 20 percent in only five, measured in MW of new capacity delivered and installed. There were only six years during this same period in which annual output did not climb more than 35 percent. There are enough indicators to warrant that this forecast is plausible and well within historic norms. We can say with reasonable confidence that this industry is not the next economic “bubble” waiting to burst. Consistently strong growth is expected to continue not only through the next 10 years but probably the two or three decades after that as well.
Undoubtedly, the ramp-up in production will have a positive impact on composite blade manufacturing. The indirect measure of MW of new installed capacity only tells us so much about what products are being built and how many blades will be required. Several factors must be taken into account as we develop more precise measures.
Bigger blades, better boost
First, the rapid escalation in individual turbine generating capacities and the corresponding growth in rotor sizes (see illustration, second image down, at right) is an established trend that we can see from Fig. 5 will continue. In the past 10 years, the average rated capacity for a wind turbine has doubled — effectively halving the number of turbines and blades needed to supply a given amount of power. In next 10 years, the average size is expected to grow to 2.5 MW or greater. As a result, while annual MW forecasts for new wind capacity will grow by a factor of about 5 over the next decade, the number of turbines necessary to provide that capacity only needs to triple.
Second, while Fig. 5 shows that the majority of new capacity will continue to come from turbines with rated capacities of 1.6 MW to 2.5 MW, we can see that larger turbines will claim an increasing share. Vestas Wind Systems A/S (Randers, Denmark) has been selling its V90 turbine, rated at 3.0 MW, for a few years now, and several companies have firm designs on turbines rated up to 7.5 MW. These immense turbines are destined almost exclusively for offshore wind farm developments where greater available wind resources will allow them to produce, in a given day, almost twice as much electricity as can the typical turbines erected onshore. As companies become more comfortable with the logistics of offshore wind development, an increasing number of turbines will be built to tap this potential — by 2017, perhaps 20 percent of the total units shipped.
Despite the upward trends in size, we don’t anticipate that smaller classes of turbines will disappear altogether. Sub-1.0-MW turbines are still effective systems in areas that need only limited amounts of power. They also, at least in the context of the Chinese and Indian wind energy booms, have provided a technology starting point that enabled new turbine and blade manufacturers in these countries to enter the business.
Assuming that (as service records show) only a small portion of the composite blades that are placed into service fail to the point of replacement and that the vast majority of turbines built over the next 10 years will be of the standard three-bladed configuration, we can reasonably calculate approximate current and future figures for rotor blade production. Beginning with our estimate of 43,777 blades in 2007 (see Fig. 6) and accounting for the evolving product mix, the number of blades needed to meet annual turbine production forecasts will grow by a factor of 3.2, to 140,864 by the end of the next 10 years.
Better metrics, bigger business
To meet this demand, wind blade manufacturers are expected to increase their current aggregate annual production capacity by at least 100,000 MW. Because the industry is already very cost-competitive and sensitive to volumes of scale, the average output of each new blade plant that will be built during the next few years is expected to be about 1,500 rotor blades per year — equal to about 1,000 MW of new turbine capacity and roughly 20 million lb (9,000 metric tonnes) of composite blades. Already, many manufacturers are expanding their existing blade plants to produce considerably larger quantities of blades. Tonnage and MW figures should continue to trend upwards.
This would indicate that over the next 10 years there could be enough business to support the construction of perhaps 70 to 80 new wind turbine blade factories. These new plant estimates do not account for the inevitable closure of a few older blade manufacturing facilities and equivalent capacity to replace that production elsewhere. Since 2000, at least five older European facilities (each specializing in sub-1.0-MW turbine blades) have been shuttered. Undoubtedly there will be others as blade manufacturing continues to globalize. We anticipate that nearly three-quarters of this new capacity will need to be placed into service in the second half of the 2008 to 2017 time frame. The logistical difficulty involved in transporting these large blades from factory to wind farm will dictate that factories be local to demand. Therefore, about two-thirds of the new blade factories that will come online over the next 10 years are likely to be built in the developing markets across Asia — especially in India and China — and, to a lesser extent, in South and Latin America. Only about 32 percent of the new blade manufacturing capacity will be built in regions currently in the vanguard of wind energy development: 20 percent of the new capacity is expected to be located in Europe, and North America will see the remaining 12 percent of the capacity expansions.
Better future, biggest market
Based on some of the metrics developed for this market outlook, it was determined that a typical rotor blade for a 0.75-MW turbine has a length of 80 ft to 85 ft (24m to 25m) and weighs approximately 5,200 lb/2,360 kg. At this size, blades are estimated to cost about $55,000 each, or $165,000 for a three-blade set. As blades grow larger, the amount of reinforcement increases in a logarithmic progression. For a 1.5-MW turbine, typical blades should measure 110 ft to 124 ft (34m to 38m) in length, weigh 11,500 lb/5,216 kg and cost roughly $100,000 to $125,000 each. Rated at 3.0 MW, a turbine’s blades are about 155 ft/47m in length, weigh about 27,000 lb/12,474 kg and are valued at roughly $250,000 to $300,000 each.
When we total the mass of the 43,777 wind turbine blades made during 2007, using the above guidelines, wind turbine manufacturers produced approximately 441 million lb or slightly more than 200,000 metric tonnes of finished blade structures last year — making wind turbine blade manufacturing one of the largest single applications of engineered composites in the world. Incredibly, 2007’s staggering volume is almost 38 percent higher than 2006 and almost double the 2005 figure.
The total breaks down, approximately, as follows:
• Glass fiber – 221 million lb (100,240 metric tonnes)
• Carbon fiber – 4.6 million lb (2,090 metric tonnes)
• Thermoset resins (primarily epoxy and vinyl ester) – 182 million lb (82,550 metric tonnes)
• Core (balsa and foam) – 18 million lb (8,160 metric tonnes)
• Metal (fittings and bolts) – 15 million lb (6,800 metric tonnes)
The value of the blade market is often estimated simply as a percentage of the turbine market. It is generally assumed that blades account for 15 to 20 percent of the total purchase price of wind turbines. The market for complete wind turbine systems during 2007 is estimated to have totaled slightly more than $26 billion. From this, it should be expected that the value of the composite blade market would range somewhere between $3.9 and $5.2 billion. Based on current material prices and our estimates of manufacturing and overhead costs (previously noted), we believe that a more precise estimate of the composite blade market is $4.3 billion. That’s a 43 percent increase over estimated 2006 blade sales and 114 percent greater than the figure for 2005. Based on the expected industry-wide growth this year, blade manufacturers should ship more than $5.9 billion worth of product. This value represents a monetary growth of 38 percent, while new installed capacity (MW) is expected to increase 26 percent. Although part of this disproportionate growth in blade value can be attributed to steadily increasing prices of raw materials (as petroleum and other chemical feedstocks become more expensive), more important factors are product availability/shortages, and the trend toward larger turbines with more expensive rotor systems.
Over the next 10 years, the rapid growth in new installed capacity will drive up annual blade production from 589 million lb (0.26 million metric tonnes) in 2008 to 2.66 billion lb (1.18 million metric tonnes) by 2017, totaling 13.69 billion lb (6.21 million metric tonnes) of structures. Based on these estimates, without adjusting for inflation, we forecast that the value of manufactured blades will grow from $5.9 billion this year to approximately $34 billion per year by 2017. Of this total, the carbon fiber-reinforced polymer component represents slightly less than 4 percent of the total market value. By the end of this forecast period, it is expected that CFRP structures will represent about 19 percent of the blade market’s value, although they will represent only about 8.5 percent of blade manufacturer output by weight.
This year, consumption of fiberglass and thermoset resin systems is expected to grow by about 31 percent compared to 2007. As blades become longer, their skins generally include thicker core sections. This trend is expected to drive core material requirements up 38 percent over the volume estimated for 2007. Because the number of large onshore and larger offshore turbines is going up, the use of carbon fiber is expected to double this year compared to 2007 levels. Whereas carbon fiber made up only about 2.2 percent of the total tonnage of blades produced in 2007, it should account for 5 percent of the tonnage in 2017. At that point, our calculations show that the wind energy industry could require as much as 132.2 million lb (60,000 metric tonnes) of carbon fiber per year. That figure is nearly twice the quantity of PAN-based carbon fiber that was available for all of the world’s many carbon-reinforced composite applications last year! This will surely make wind turbine blades the world’s largest single application for carbon fiber reinforcements.


Related Content

Polar Technology develops innovative solutions for hydrogen storage
Conformable “Hydrogen in a Box” prototype for compressed gas storage has been tested to 350 and 700 bar, liquid hydrogen storage is being evaluated.
Read More
Development of a composite liquid hydrogen tank for commercial aircraft
Netherlands consortium advances cryogenic composites testing, tank designs and manufacturing including AFP, hybrid winding, welding of tank components and integrated SHM and H2 sensors for demonstrators in 2025.
Read More
Composites end markets: Pressure vessels (2025)
H2 economy is set back by Trump policies, tariffs and funding pivot to defense and AI, but composite tanks remain a key segment with sales in CNG/RNG, growth in New Space and potential for H2-electric aviation.
Read More
SRI develops scalable, infiltration-free ceramic matrix composites
Work in two DOE projects is demonstrating C/C-SiC produced in 3-5 days with <5% shrinkage, <10% porosity and 50% the cost of conventional C/C and C/C-SiC.
Read MoreRead Next

Industrial ultrasonic NDT adaptation permits accessible composite bicycle inspection
Cycle Inspect's ASNT-aligned certification program employs affordable twin-crystal ultrasonic testing equipment and standardized inspection methods to detect damage in composite bicycle components.
Read More
Report: Composites and Carbon Fiber Use in Hydrogen Storage
A first-of-its-kind technical report that assesses the materials, manufacturing processes, market and energy trends driving use of carbon fiber composites in global hydrogen (H₂) storage applications for fuel cell-powered trucks, buses, trains and passenger vehicles.
Read More