
How ready are progressive damage analysis tools?
In the past 15 years, progressive damage analysis (PDA) for composites, implemented in finite element analysis software, has been under development.


In the past 15 years, progressive damage analysis (PDA) for composites, implemented in finite element analysis software, has been under development. Some PDA proponents argue that “virtual testing” of this sort is, today, reliable enough to reduce or even replace the conventional “building block” approach to composite design that relies on physical testing. Although that could, in some cases, save significant time and cost in the development of composite structures, the results of a recent evaluation of the state of the art in this area, overseen by the Air Force Research Laboratory (AFRL, Wright-Patterson AFB, OH, US), indicates that comparative experimental fatigue data do not yet justify such confidence.


Benchmarking PDA progress
An AFRL benchmarking exercise titled, “Damage Tolerance Design Principles (DTDP),” conducted by Steve Engelstad of the Advanced Development Program at Lockheed Martin Aeronautics Co. (Lockheed Martin, Ft. Worth, TX, US) and myself from January 2014 through April 2015 asked the question, Can current PDA methods accurately predict initiation and growth of damage in composites? An intensive effort, it involved both static and fatigue blind predictions, using several PDA methods. To evaluate existing tools for composites damage progression modeling and prediction for future application of damage growth analysis needs, AFRL, as an impartial organizer, provided identical physical test data results to program participants who would use the data for PDA model calibration/ validation. The static data included 0° tension and compression, 90° tension and compression, V-notch shear, 90° three-point bend, Mode I double cantilever beam, and Mode II end-notched flexure. The fatigue data included 0° S-N, 90° S-N, ±45° S-N, 90° three-point bend S-N, Mode I double-cantilever beam fatigue, and Mode II end- notched flexure fatigue. Since brittle failure in 90° matrix-dominated tests resulted in low strength values and high fatigue scatter, AFRL is currently conducting follow-on research to improve test methods.
Although there is not room here to examine the entire project, comparisons of fatigue predictions derived via PDA against physical open-hole fatigue test data for three different layups will serve to illustrate what we learned. The ultimate goal of this effort was to generate quality fatigue test results, along with high fidelity X-ray CT images that would enable us to assess the ability of the PDA methods to predict damage and residual strength after fatigue.
The layups were of IM7 HexTow carbon fiber (Hexcel, Stamford, CT, US) and Cytec CYCOM 977-3 epoxy resin (Solvay Composite Materials, Tempe, AZ, US), in the following ply sequences: [0°/45°/90°/-45°]2S, [60°/0°/-60°]3S, [30°/60°/90°/-60°/-30°]2S.
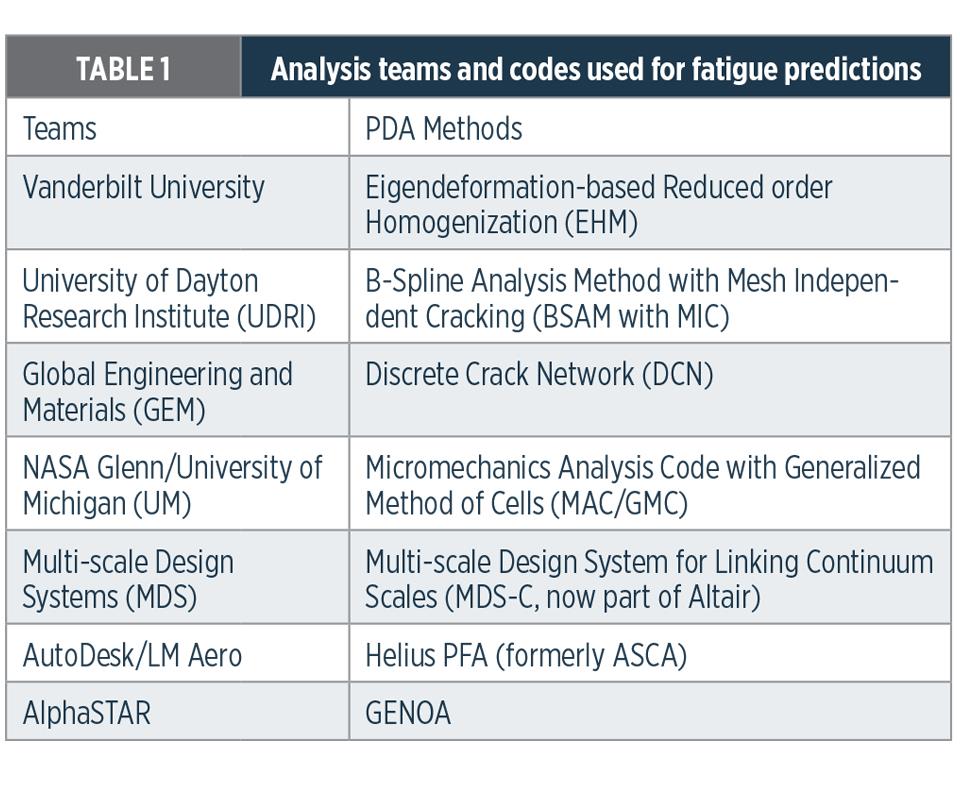
It should be noted that in the static phase of the AFRL bench-marking exercise, nine analysis teams had already performed blind static predictions and then recalibrated the parameters in their models based on the results of 12 experimental load cases. Lessons learned during the program’s static portion included more accurate determination of material properties for some model inputs, appropriate mesh sizes and orientations, and accurate representation of boundary conditions. Additionally, some PDA teams identified and corrected algorithm errors within their analysis codes. Seven of the teams then applied these lessons learned to their fatigue predictions during the benchmarking exercise’s second phase. The teams and their PDA methods are listed in Table 1 above.
Calculating correlations
The benchmarking analysis protocol proceeded as follows: Each PDA participant initially submitted blind fatigue predictions for each of the three layups, after which the experimental (physical test) results were provided to each team, and then each participant was permitted to submit “recalibrated” fatigue predictions.
For 10 samples of each layup, the fatigue cycling was stopped after a predetermined number of cycles to allow measurement of the static residual stiffness and strength properties. Five replicates were tested in tension and five replicates were tested in compression. The goal was to impart a measurable amount of damage into the open hole composite specimens in a reasonable amount of time so that the ability of the PDA codes to predict the right type, amount and location of damage as a function of cycles could be assessed.
As a result of screening tests, the maximum stress level in terms of percent of static ultimate strength for the [0°/45°/90°/-45°]2S layup was 50%, for the [60°/0°/-60°]3S layup was 80%, and for the [30°/60°/90°/-60°/-30°]2S layup was 40%. Static ultimate strength was 554 MPa for the [0°/45°/90°/-45°]2S layup, 543 MPa for the [60°/0°/-60°]3S layup, and 409 MPa for the [30°/60°/90°/-60°/ -30°]2S layup. The residual tensile and compressive properties of the coupon with the [0°/45°/90°/-45°]2S layup were measured after 300K cycles while the residual properties of the coupons with the other two layups were measured after 200K cycles. Residual tensile measured after 1,000K cycles and 1,500K cycles. The purpose of the higher cycle count tests was to assess the ability of the PDA codes to predict stiffness degradation resulting from increasing levels of damage from continued fatigue loading, or to predict the life of the specimen if two-part failure occurred. The [0°/45°/90°/-45°]2S specimens resulted in two-part failure prior to 2,000K cycles while the other two layups experienced a stiffness reduction but not two-part failure. This result proved to be a good indicator of the PDA capabilities, because many codes predicted two-part failure in some cases where the physical test specimens did not completely fail.
To enable observers to assess the ability of the PDA methods to capture the correct damage type and location in the open-hole fatigue specimens, X-ray tomographs were obtained intermittently during the physical fatigue testing portion of the program. “Recalibrated” models captured the location of damage relatively accurately, and the discrete damage models, BSAM and DCN, due to the discrete damage nature of their formulations, more distinctly captured the narrow features of matrix cracks than the other models.
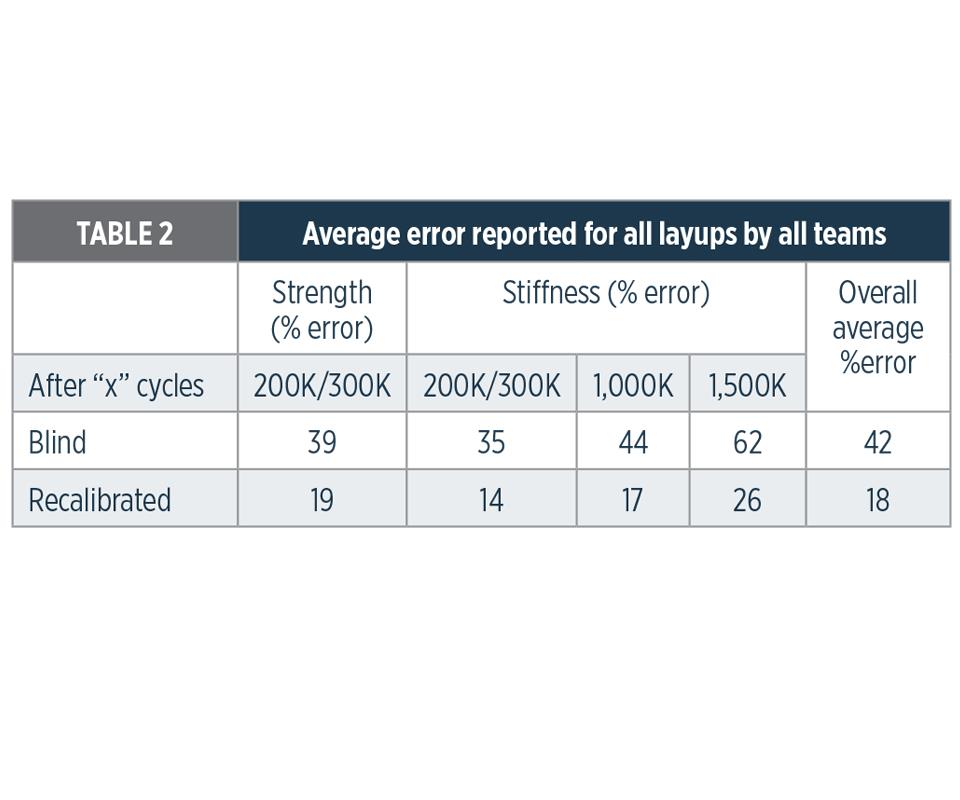
The fatigue blind prediction and recalibration comparisons, in terms of average percent error, are presented in Tables 2 and 3. Table 2 shows the overall average residual stiffness/strength percent error across all teams and all layups, as a function of different cycle points. For the fatigue results, on average, the blind predictions of residual properties after fatigue differed from the test by 42%, and the recalibrations differed from the test by 18%.
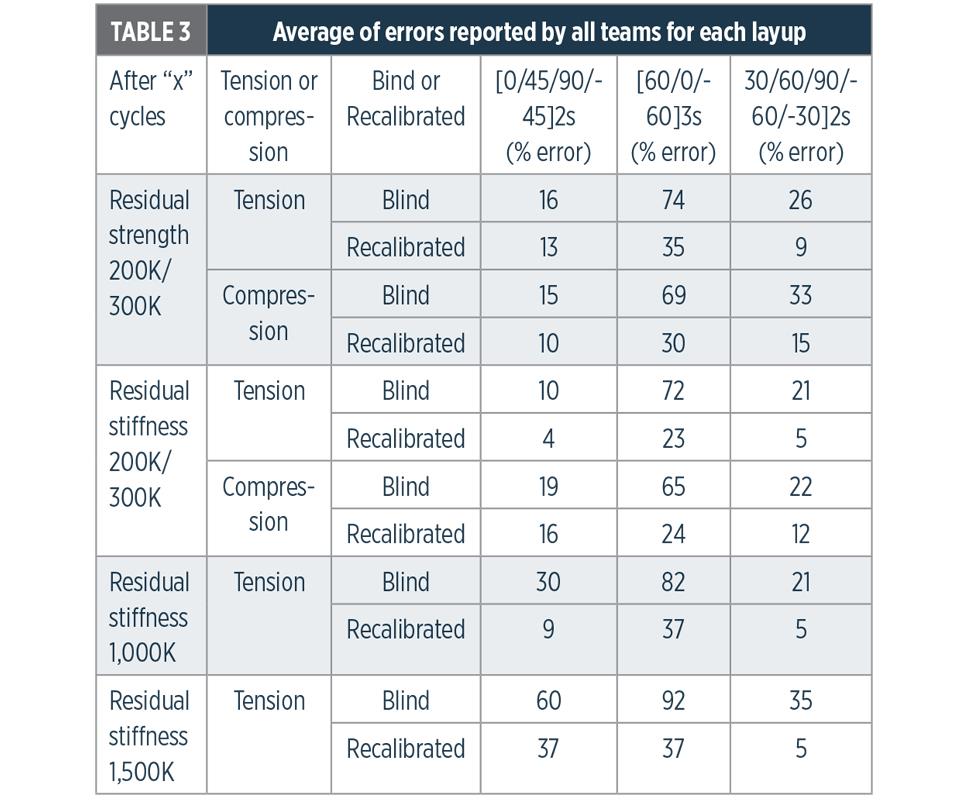
For a given layup, PDA participants’ blind fatigue predictions generally correlated better to the physical test results at low cycle counts, with the poorest correlations seen after cycle counts greater than 1,500K. As Table 3 demonstrates clearly, the [60°/0°/-60°]3S layup showed by far the poorest correlation between the blind and recalibrated predictions and the physical test data. (It should be noted that in the static phase of the AFRL benchmarking exercise, the blind predictions differed from the test by 18%, and the recalibrations differed by 8%. Thus, the fatigue simulations differed from test more than the static simulations by a general factor of two).
Conclusions
It is important to state one finding relative to a lack of capability found in many of the micromechanics codes. It was discovered that most of the codes were in the initial stages of development of fatigue capabilities (during the program timeframe), and did not yet have discrete interlaminar fatigue capability. However, some micro-mechanics codes attempted to simulate delaminations through element stiffness degradation. This capability is very important for many of the applicable aircraft problems. AFRL and Lockheed Martin are interested in assessing the current state-of-the-art and determined this area to be a technology gap.
All the PDA teams had more issues with residual stiffness/strength predictions after fatigue for the [60°/0°/-60°]3S layup than they did with the other two layups, both for the blind predictions and recalibrated results. In particular, many of the blind predictions failed to capture the correct fatigue failure mechanisms for the [60°/0°/-60°]3S layup. Note that this fatigue benchmark exercise was for an R-ratio of 0.1 (all tension) constant amplitude cycling. Much additional work is needed to handle compressive and spectrum loading. To improve the “predictiveness” and maturity of these fatigue analysis tools, a more extensive set of experiments and associated modeling studies should be designed to handle these general spectrum loading effects.
For the fatigue results, the blind predictions differed on average from the test by 42%, and the recalibrations differed by 18%. Thus, for fatigue, it was concluded that the current accuracy of the fatigue PDA tools is low for predicting the response of these notched R=0.1 constant amplitude tests. ere are many formulations with a wide variation in the level of verification and validation for each. Improving these fatigue formulations is a necessity if PDA tools are to be used to accurately predict the effects of fatigue on aircraft structures.


Related Content

Dialing in composites performance via dynamic digital twins
Sport Dynamics Lab uses Flexdynamics testing, digital models and AI tools to compare designs, materials and systems, enabling optimization with potential for propellers, drones and vibrational structures.
Read More
Schrödinger advances materials informatics for faster development of next-gen composites
Cutting time to market by multiple orders of magnitude, machine learning and physics-based approaches are combined to open new possibilities for innovations in biomaterials, fire-resistant composites, space applications, hydrogen tanks and more.
Read More
Mercedes-AMG Petronas F1 Team to include sustainable carbon fiber for 2025 Formula 1 season
F1 team has taken first steps to qualify and apply sustainable composites into its W16 race car with help and innovation from industry partners and the FIA.
Read More
Modular approach to material card development of composites
Forward Engineering GmbH walks through a modular testing and simulation approach for automotive/aviation composites enabling more accurate material selection earlier in the design phase.
Read MoreRead Next

Advancing bonding, coating and sealing to 4.0 systems for composites, metals and more
Brighton Science uses decades of experience, 2-second surface measurements and a framework of data-based specs and KPIs to help manufacturers advance toward reliable, predictable bond quality for faster, high-performance production.
Read More
Industrial ultrasonic NDT adaptation permits accessible composite bicycle inspection
Cycle Inspect's ASNT-aligned certification program employs affordable twin-crystal ultrasonic testing equipment and standardized inspection methods to detect damage in composite bicycle components.
Read More
Report: Composites and Carbon Fiber Use in Hydrogen Storage
A first-of-its-kind technical report that assesses the materials, manufacturing processes, market and energy trends driving use of carbon fiber composites in global hydrogen (H₂) storage applications for fuel cell-powered trucks, buses, trains and passenger vehicles.
Read More