
American Clean Power reports U.S. energy highs in 2022, hurdles for 2023
According to the annual and Q1 2023 market reports, more than 25 GW of new clean power was installed, marking it the third highest year for the U.S.; however, several hurdles are delaying 60+ GW through early 2023.


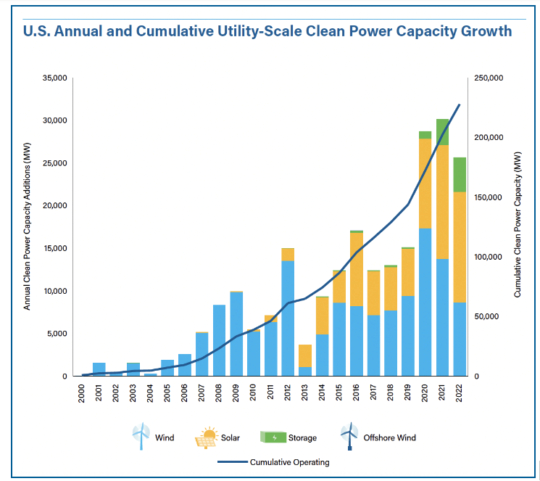
U.S. annual and cumulative utility-scale clean power capacity growth. Photo Credit: American Clean Power, “Clean Power Annual Market Report” 2022
On May 22, the American Clean Power Association (ACP, Washington, D.C., U.S.) released its comprehensive “Clean Power Annual Market Report” for 2022 and its “Clean Power Quarterly Market Report” for Q1 2023, finding that combined U.S. wind, utility solar and energy storage capacity had the third largest year on record in 2022 with more than 25 gigawatts (GW) of new clean power installed. However, a decline in deployment volume from the previous two years, combined with a historically low Q1 2023, underscore the continued headwinds facing the industry.
After historic clean energy incentives were signed into law in August 2022, ACP notes that clean power has seen record levels of announced activity, with the development pipeline swelling to nearly 140 GW by the end of Q1 2023 —11% above where it was at the same point last year. However, it is too early to see this activity translate into installations, which have slowed for the first time since 2017.


“The clean energy revolution is underway,” ACP CEO Jason Grumet says. “We have the technology, financial capital and workforce to power our economy with clean, affordable and secure energy. There is broad bipartisan support for American energy innovation. But the clean energy transition will not succeed unless Congress and governors enable the siting and construction of new energy facilities and support the build out of transmission that is required to bring clean power to the people.”
By the end of 2022, nearly 228 GW of clean energy was online, with 4 GW more added in Q1 2023. These resources provide 15% of the nation’s electricity and deliver enough electricity to power the equivalent of more than 62 million households. Clean power dominated new power capacity additions in 2022, comprising nearly 80% of all new grid additions.
Texas added twice as much clean energy capacity as any other state in 2022 (over 9 GW), maintaining its status as the state with the most operating clean power capacity (nearly 55 GW). Iowa and South Dakota each generated over half of their electricity from clean power last year.
Energy storage witnessed a record year in 2022 with 4 GW and 12 gigawatt-hours (GWh) commissioned, representing an 80% increase in total operating storage capacity. Hybrid project installations in 2022 were 60% higher than in 2021, setting a new record in the hybrid space at nearly 6 GW of installations.
In the nearly 140 GW development pipeline, solar accounts for 59% of all clean power capacity. Land-based wind accounts for 15% of the pipeline, battery storage represents 14% and offshore wind claims the remaining 13%.
Headwinds and delays
However, according to ACP, the year’s progress was not enough to continue the annual growth trajectory of U.S. clean power, with the industry seeing a decline in combined installation volume for the first time in 5 years and the lowest Q1 (2023) in 3 years.
Contributing to the slowdown in installations were delays in 2022 that affected more than 50 GW of projects in late-stage development, with a total of 63.3 GW — equivalent to powering nearly 7 million homes — experiencing delays by the end of Q1 2023. On average, these projects face delays of 6 months or longer.
Project delays are primarily due to unclear permitting timelines, trade policy uncertainty, transmission shortages, difficulties sourcing solar panels, unresolved IRA implementation, and interconnection queue challenges (with more than 1,741 GW waiting in queues at the end of 2022). These challenges must be addressed to unlock the full potential of the nearly 140 GW of clean energy in the development pipeline.
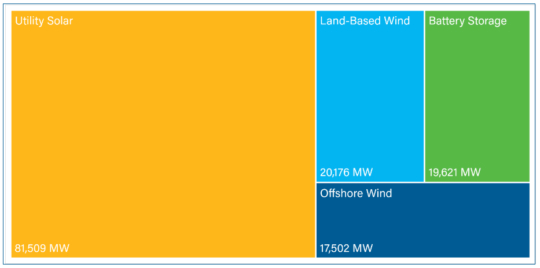
The 139 GW development pipeline by technology. Photo Credit: American Clean Power, “Clean Power Quarterly Market Report,” 2023
Key market highlights
The “Clean Power Market Reports” for 2022 and Q1 2023 are comprehensive overviews of the U.S. wind, utility solar and energy storage markets, containing in-depth analysis of key industry statistics, trends and rankings. The 180-page annual report and the Q1 2023 report are available exclusively to ACP members.
Per the annual report, additional highlights include:
- About 25.5 GW of new clean power was commissioned in 2022, making it the third largest year on record and bringing the total amount of U.S. clean power online by year’s end to nearly 228 GW.
- Clean power represented 79% of all new capacity added in 2022.
- Maintaining last year’s project installation volume would provide only 30% of what is needed to reach a net-zero grid by 2035.
- About 139 GW of clean energy projects were under development at the end of Q1 2023.
- In 2022, energy storage witnessed a record year with 4 GW and 12 GWh commissioned, representing an 80% increase in total operating storage capacity.
- The clean power industry employs 443,000 workers and invested $35 billion in capital investment in 2022.
- Clean power is red, white and blue with projects or manufacturing facilities in 93% of Congressional districts. Projects can be found in all 50 states.
- There are 550 U.S. manufacturing facilities dedicated to producing components and parts for wind, solar and storage projects in the clean power industry — and since the passage of the Inflation Reduction Act (IRA), 47 new clean energy manufacturing facilities or expansions have been announced, bringing more than 18,000 new U.S. jobs.
Some Q1 2023 highlights from the ACP market report include:
- Q1 2023 saw a 36% drop in clean power installations (4,079 MW) compared to Q1 2022. Ninety-five project phases were commissioned across 27 states, with Florida and Texas leading.
- Solar led the quarter (2,200 MW), followed by wind (1,418 MW) and battery storage (461 MW).
- Regulatory challenges led to significant project delays, especially in the solar sector, with 7.3 GW of clean power capacity expected online in Q1 delayed, for a total of 63.5 GW of clean power delayed by end of Q1. Ninety percent of Q1 delayed capacity expected to come online later in 2023.
- The development pipeline grew 11% from Q1 2022 to 139 GW, dominated by solar at 59%.
- New Power Purchase Agreement (PPA) announcements fell by 24% to 3.8 GW, with corporate buyers leading at 63%.
A public website with interactive data from the 2022 annual report can be viewed here.


.jpg;maxWidth=300;quality=90;format=webp)


Related Content

Ford Mustang Dark Horse features Carbon Revolution carbon fiber wheels
The 19-inch, five-spoke Dark Horse wheels feature signature blue carbon fiber detailing, keeping with the blue accents throughout the vehicle’s interior and exterior.
Read More
Cryo-compressed hydrogen, the best solution for storage and refueling stations?
Cryomotive’s CRYOGAS solution claims the highest storage density, lowest refueling cost and widest operating range without H2 losses while using one-fifth the carbon fiber required in compressed gas tanks.
Read More
Paris Air Show 2023 highlights
The Paris Air Show, one of the largest aerospace trade shows in the world, returned for the first time since 2019 and proved that the global aviation industry industry is very much alive and kicking.
Read More
High-performance, high-detail continuous 3D-printed carbon fiber parts
Since 2014, Mantis Composites has built its customer and R&D capabilities specifically toward design, printing and postprocessing of highly engineered aerospace and defense parts.
Read MoreRead Next

WETO funding opportunity addresses wind energy deployment challenges
Wind Energy Technologies Office releases $28 million in funding for interested parties to address barriers to the deployment of wind energy onshore, offshore and distributed.
Read More
Electric vehicle analysis ranks most-ready hubs for EV adoption
StorageCafe examines 100+ U.S. metropolitan areas and ranks the top 10 by number of EVs, public chargers, electricity cost, infrastructure challenges, clean energy, EV insurance costs, local incentives and more.
Read More
Composites end markets: Energy (2024)
Composites are used widely in oil/gas, wind and other renewable energy applications. Despite market challenges, growth potential and innovation for composites continue.
Read More