
Composites Business Index 51.6: Contraction ends, trend is up
Gardner Business Media's director of market intelligence Steve Kline, Jr. makes his debut as an HPC columnist in By the Numbers, where he will plot a new measure of the composites industry's economic health, the Composites Business Index.
.JPG;width=70;height=70;mode=crop;format=webp)

Steve Kline is the director of market intelligence for Gardner Business Media Inc. (Cincinnati, Ohio), the parent company and publisher of High-Performance Composites. Kline holds a BS in civil engineering from Vanderbilt University and an MBA from the University of Cincinnati.
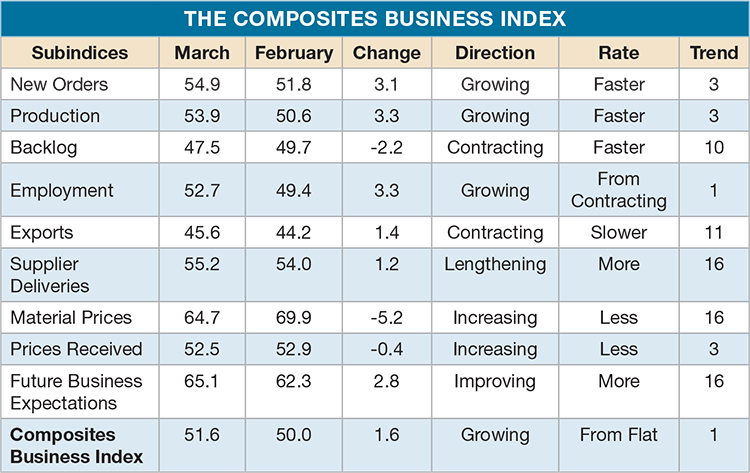
The Composites Business Index for March, released April 1, 2013


Since December 2006, Gardner Business Media has computed a business index for the U.S. metalworking industry. In December 2011, Gardner began to survey manufacturing facilities across all of the durable goods sectors covered by its publications. After tracking the index’s performance in these sectors for two years, we are now ready to publish regular reports. In “By the Numbers,” I’ll present to HPC readers the U.S. Composites Business Index (CBI).
The CBI is a diffusion index. It compares business conditions month by month. We survey composites manufacturing facilities monthly and collect data on new orders, production, backlogs, employment and other quantifiable factors. We weight these subindices to create an overall index. A reading above 50 indicates expansion. A reading below 50 shows contraction. HPC readers who are familiar with the Institute for Supply Management (ISM) index will easily grasp the CBI because the CBI survey asks the same questions and its results are similarly calculated. The CBI’s advantage, of course, is that survey results are focused on composites fabrication.
Gardner’s first published CBI, released March 1, was an even 50.0, indicating that composites activity was flat in February compared to January. This ended five consecutive months of contraction in composites fabrication. New orders and production, however, grew during that time. Growth of new orders slowed slightly, and the production growth rate accelerated. But, the growth rate for new orders was faster than the rate for production, so the rate of contraction in backlogs slowed to near flat in February.
The CBI moved up to 51.6 during March, showing overall growth for the first time since August 2012. New orders continued a three-month growth arc, reaching in March the highest growth rate since May 2012. Production grew in January and February then really picked up in March. Employment moved from contraction to expansion and has maintained a general upward trend since bottoming out in December 2012. These three sub-indices are the drivers that got the composites industry growing again.
Supplier time to delivery continues to lengthen, which indicates supply chain strength. Although exports contracted for the 11th consecutive month, they raised the overall index in March because the rate of contraction slowed. Exports, however, will continue to contract because the dollar is under pressure from a falling yen (the result of increased quantitative easing) and a down euro (due to ongoing trouble in the banking industry). Despite strong growth in new orders, backlogs continue to contract. This shows significant available production capacity.
The material prices growth rate slowed markedly in March after rising at an increasing rate since July 2012. Prices received by composites manufacturers grew at a much slower pace. These trends and an employment upswing show that profits are under pressure. Business expectations improved in the past five months, but expectations have been somewhat range-bound since July 2012.
Facilities with 50+ employees grew at a consistent rate in the first three months of 2013. In January and February, overall growth was driven by these larger producers, but in March, smaller facilities finally joined the trend, after contracting every month since the summer of 2012.
In March, there was strong growth in the West North Central, South Atlantic, Middle Atlantic, East South Central and Pacific, with contraction elsewhere, save New England, which continued a no-growth streak begun in October 2012.
Average spending per plant on capital equipment for the coming 12 months is a volatile metric, but since December 2012, future spending plans have been on an upward trajectory. The Middle Atlantic, East North Central, South Atlantic, and West North Central show the best trajectories. Spending plans are most improved in facilities with 20 to 99 employees.


Read Next

From the CW Archives: The tale of the thermoplastic cryotank
In 2006, guest columnist Bob Hartunian related the story of his efforts two decades prior, while at McDonnell Douglas, to develop a thermoplastic composite crytank for hydrogen storage. He learned a lot of lessons.
Read More
CW’s 2024 Top Shops survey offers new approach to benchmarking
Respondents that complete the survey by April 30, 2024, have the chance to be recognized as an honoree.
Read More
Composites end markets: Energy (2024)
Composites are used widely in oil/gas, wind and other renewable energy applications. Despite market challenges, growth potential and innovation for composites continue.
Read More