
Composites Business Index 50.9: Industry returns to growth
Gardner Business Media's director of market intelligence Steve Kline, Jr. makes his debut as an CT columnist in By the Numbers, where he will plot a new measure of the composites industry's economic health, the Composites Business Index.
.JPG;width=70;height=70;mode=crop;format=webp)

Steve Kline is the director of market intelligence for Gardner Business Media Inc. (Cincinnati, Ohio), the parent company and publisher of High-Performance Composites magazine. He started as a writing editor for another of the company’s magazines before moving into his current role. Kline holds a BS in civil engineering from Vanderbilt University and an MBA from the University of Cincinnati.
The Composites Business Index for May 2013, released June 1, 2013


Since December 2006, Gardner Business Media (GBM) Inc. has computed a business index for the U.S. metalworking industry. In December 2011, GBM began to survey manufacturing facilities across all of the durable goods sectors covered by its publications. After tracking the index’s performance in these sectors for two years, we are now ready to publish regular reports. In “By the Numbers,” I’ll present to CT readers the U.S. Composites Business Index (CBI).
A diffusion index, the CBI compares business conditions month by month. GBM surveys composites manufacturers monthly to collect data on new orders, production and other quantifiable factors, and then weights these subindices to create an overall index. A reading above 50 indicates expansion — below 50 shows contraction. CT readers who are familiar with the Institute for Supply Management (ISM) index will easily grasp the CBI because the CBI survey asks the same questions, and its results are similarly calculated.
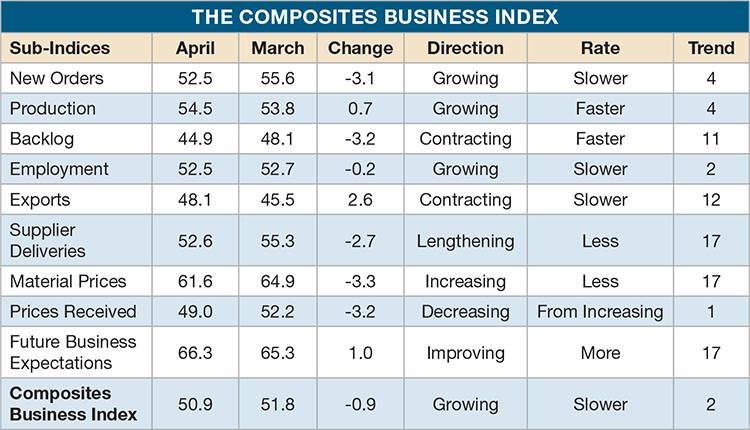
GBM’s first published CBI, released March 1, was an even 50.0, indicating that composites activity was flat in February. This ended five consecutive months of contraction in composites fabrication. On April 1, the March CBI hit 51.6, showing overall growth for the first time since August 2012. New orders continued a three-month growth arc, and in March, reached their highest growth rate since May 2012. Production grew in January and February, but really picked up in March. Employment moved from contraction to expansion. These three subindices were the drivers that got the composites industry growing again. Exports contracted for the 11th consecutive month but made a positive contribution to the overall index in March as the rate of contraction slowed. The only subindex that weighed on the industry in March was backlogs, which continued to contract despite strong growth in new orders. This indicated that there was significant available production capacity. But the material prices growth rate slowed considerably in March while prices received grew at a much slower pace. Combined with employment growth, these trends indicated that profits were under pressure.
In April, the CBI of 50.9 indicated continued growth, but at a lower rate than in March. New orders grew for the fourth month, but also at a slower rate — one of the most significant reasons the overall rate slowed in April. Production grew for the fourth month, and its rate accelerated each month. Slowing new orders growth combined with accelerating growth in production is the likely reason that backlogs contracted faster in March and April, and another significant reason the composites industry slowed slightly in April. Employment grew for the third time in four months. Exports continued to contract as the dollar remained relatively strong against world currencies. Supplier deliveries, which lengthened at a steadily increasing rate since October 2012, lengthened at their slowest rate since November 2012. Meanwhile, material prices increased, but at a much slower rate than in February. Prices received contracted for the first time since November 2012. Increasing material prices, decreasing prices received, slightly slower new order growth and increasing employment put pressure on profits. Declining prices received and faster contraction in backlogs again indicated excess capacity.
Business expectations continued to improve and reached their highest level since June 2012. Throughout the first four months of 2013, facilities with more than 50 employees grew at a significant rate. But in April, facilities with fewer than 50 employees began to contract again, which is the primary reason April’s growth rate slowed. Regionally, the East South Central, Pacific and West North Central grew in each of the past two months. New England and the West South Central region grew in April. But the Middle Atlantic and South Atlantic moved from growth to contraction, and the East North Central and Mountain regions, in April, had contracted for at least the previous two months.
In April future captial spending for the coming 12 months was expected to be $1.02 million, which is roughly 10 percent above the historical average.


Read Next

By the Numbers: The Composites Business Index
Composites Technology magazine's editor-in-chief Jeff Sloan introduces a new column focused on business trends in the composites industry. Written by Steve Kline, Jr., the the director of market intelligence at CT's parent company Gardner Business Media Inc. (Cincinnati, Ohio), this regular offering will gauge composites industry growth (or lack thereof) by means of metrics compiled in the Composites Business Index.
Read More
Composites end markets: Energy (2024)
Composites are used widely in oil/gas, wind and other renewable energy applications. Despite market challenges, growth potential and innovation for composites continue.
Read More
From the CW Archives: The tale of the thermoplastic cryotank
In 2006, guest columnist Bob Hartunian related the story of his efforts two decades prior, while at McDonnell Douglas, to develop a thermoplastic composite crytank for hydrogen storage. He learned a lot of lessons.
Read More