


Photo Credit all images: Twenco
Cor Boksem founded Twenco (Vriezenveen, Netherlands) in 2007, based on his experience in producing wind blades since the 1980s. “That led to developing latest-technology drilling machines for the blade roots and more intelligent electrically heated molds,” says Boksem. Over the years, Twenco has developed the latter to provide increasingly more process control.
In addition to its drilling machines for root diameters up to 6 meters, Twenco is now focusing on two products: smart molds for a wide range of composites and its NDT [nondestructive testing] analyzer. Both have driven Twenco to develop sensor technology that it describes as “non-invasive dielectric analysis (DEA)”. The company has demonstrated this sensor’s ability to monitor resin flow and cure in resin infusion, as well as temperature, viscosity and crystallization in composite welding including resistance and induction welding processes. Boksem also has a vision for future developments that will enable manufacturers to see inside composites processes and provide quality assurance (QA) by scanning during serial production.
Moving to smart molds
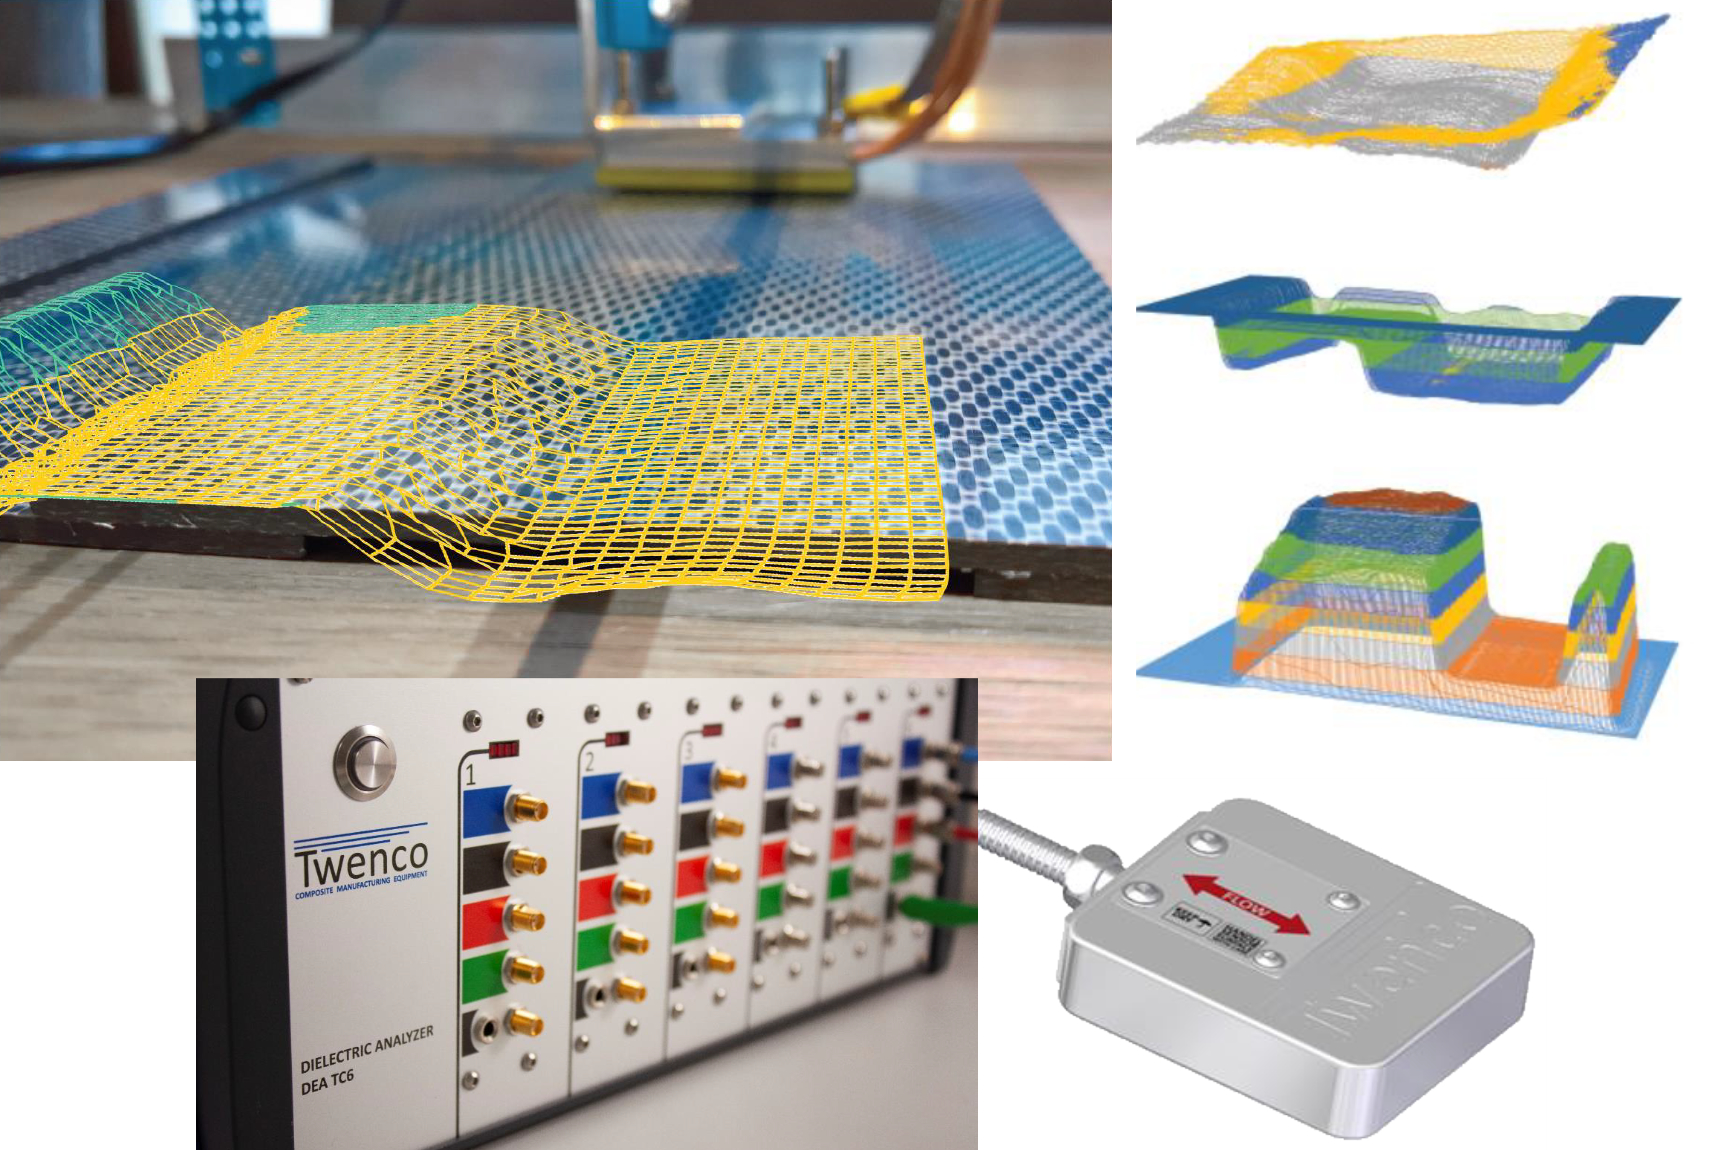
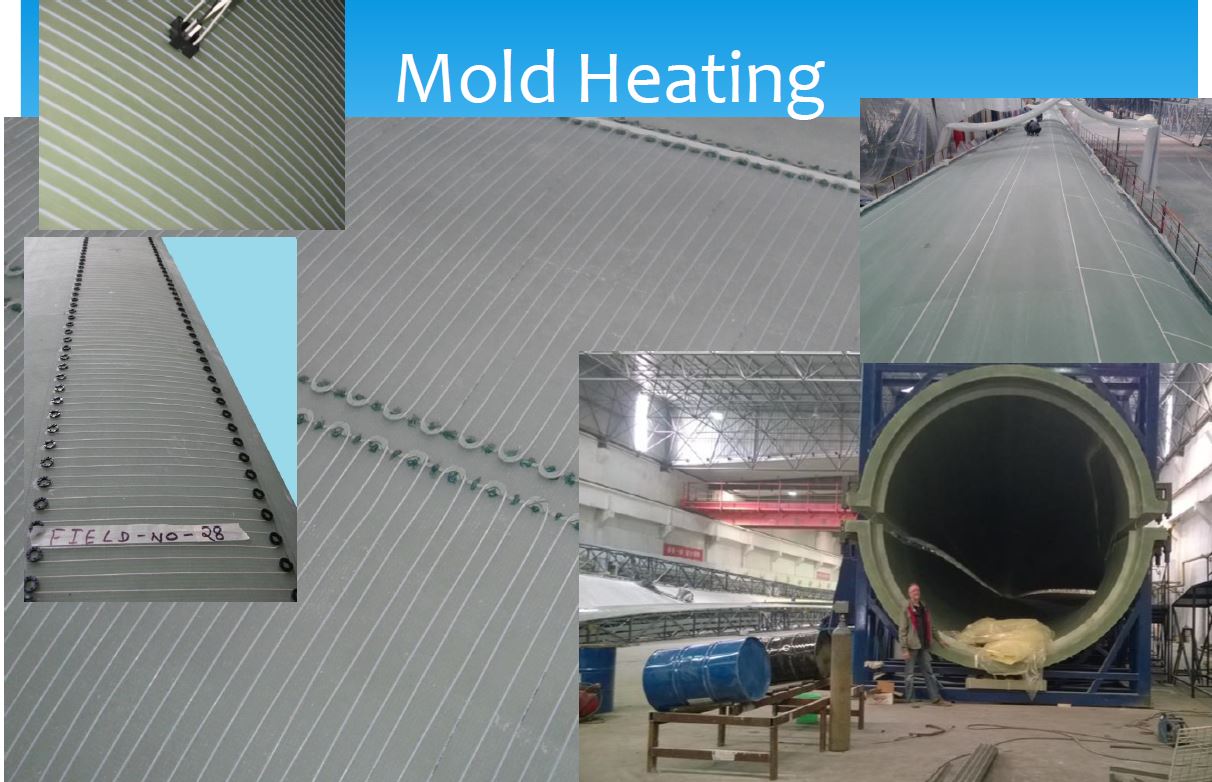
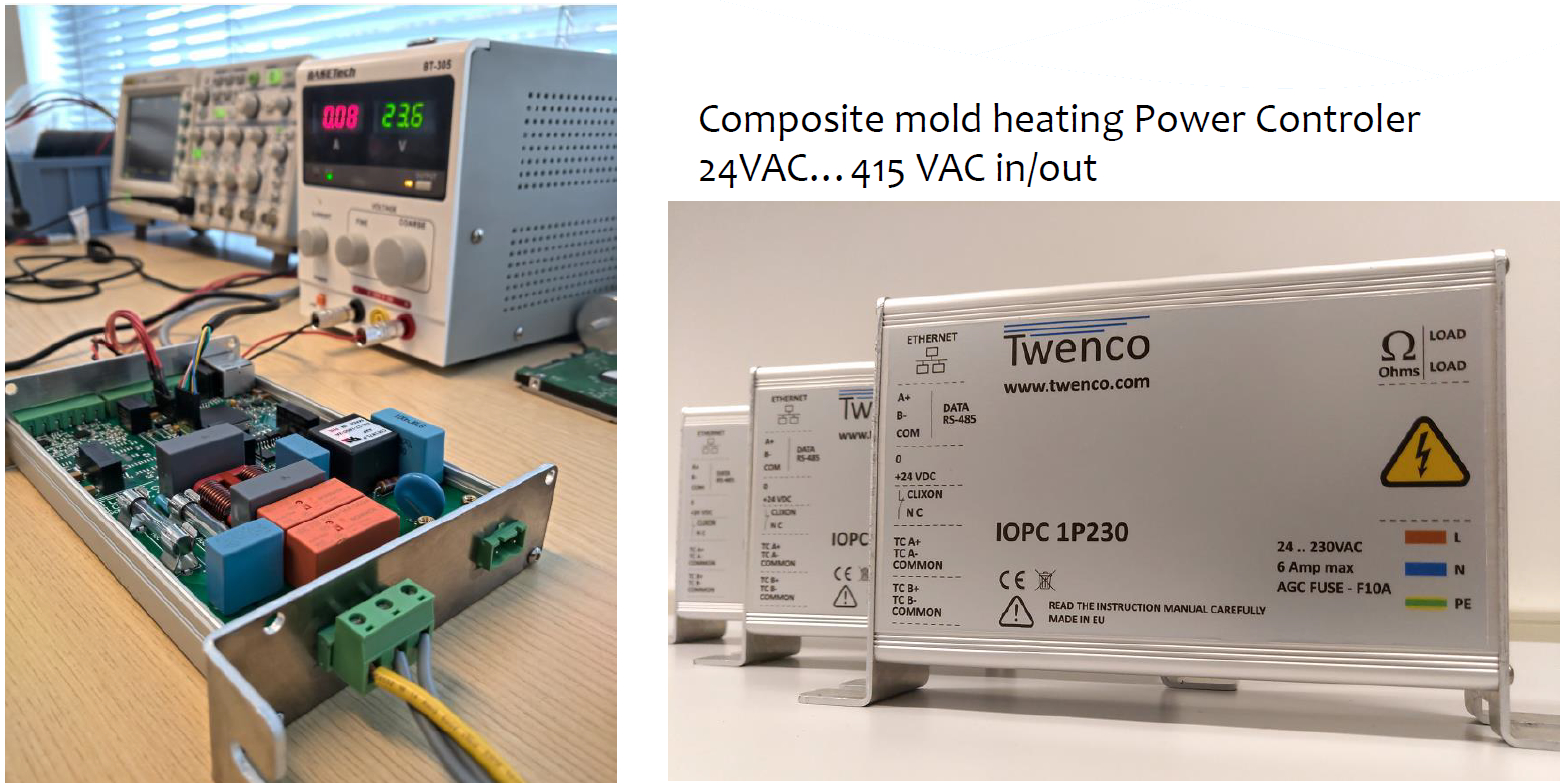
“Twenco’s composite molds for wind blades use kilometers of wire and thousands of inputs/outputs,” says Boksem, “all managed with a single IPC [intelligent process controller, bottom photo].” You can see Boksem in the collage at right, standing in front of the annular root end of a large blade mold. “We deliver the mold with everything installed,” he adds, “including all the wiring and electronics we developed in-house.”
The mold shown above delivers one megawatt of installed power for molding parts at up to 130°C, explains Boksem, “even under cold shop floor conditions. In series production, the load can be automatically limited according to the available electrical connection.” The neat lines in the photos are resistance wire wrapped around positioning rings, similar to an underfloor heating system in a home. “We have developed newer systems that are just strips you click together,” he notes. “This helps when installing 500 heating zones in an 80-meter-long mold. The benefit is that you can heat every spot.”
Why so many zones? Because the different parts of the blade use different materials and construction. “The spar is very thick,” says Boksem, “while the trailing edge uses foam or balsa core that has an insulating effect. Every zone is designed to provide the heat that is needed in that location. The large number of zones allows us to control that heating quite precisely. And our controller [at right] is just one module but provides control for every zone to ±0.10°C.”
“One of the problems for us, however, was to see what was happening inside the mold during the resin infusion process,” he continues. In the early 2000s, Twenco began looking for sensors to help with this, but couldn’t find what they needed. “In 2014, I saw an article about a new electronic integrated circuit (IC) with the possibilities that we were looking for,” he says. An IC integrates several analog or digital circuits. “But this new type featured low noise,” Boksem explains, “which made it possible to measure weak signal with a high accuracy and resolution. Using these ICs, we made a proof of concept in 2015 that could see the materials changing during infusion,” says Boksem.
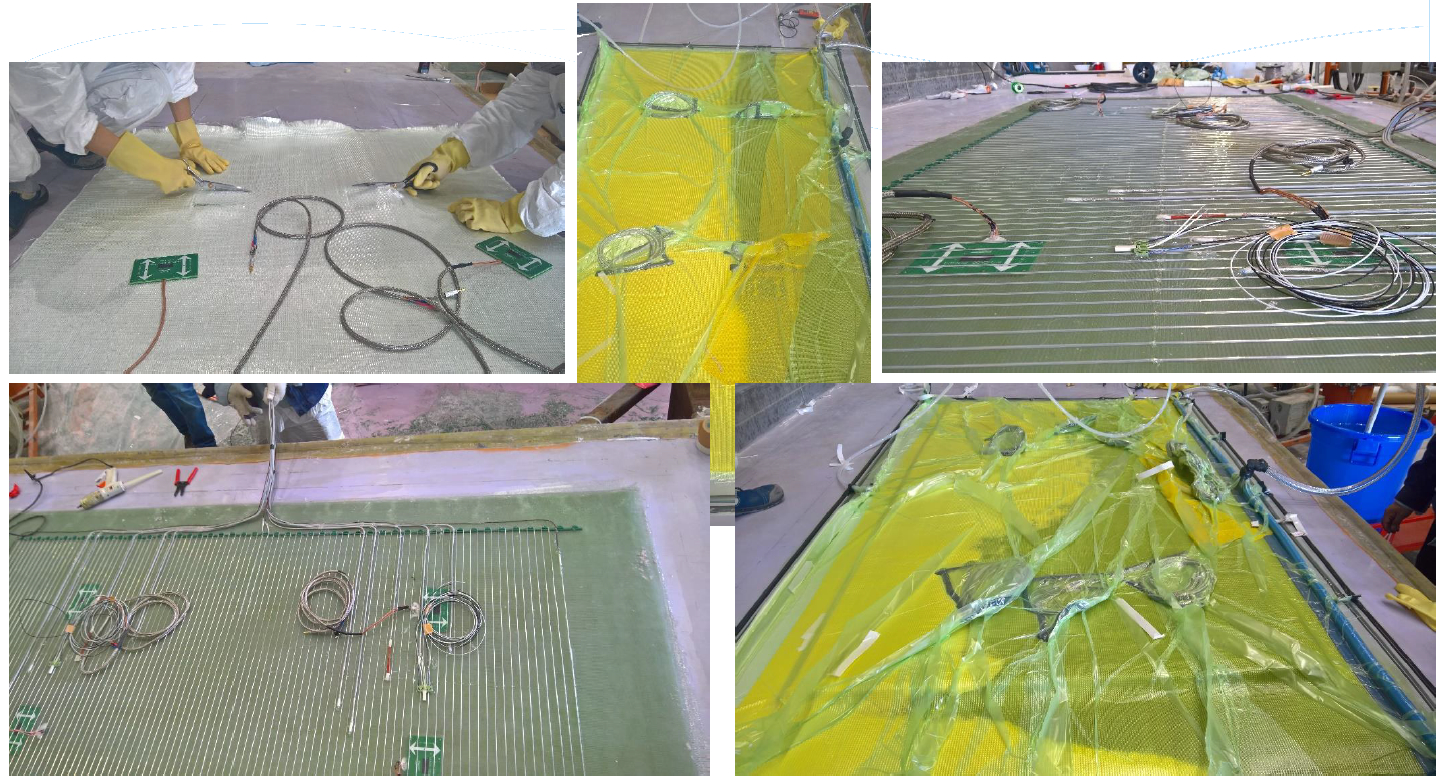
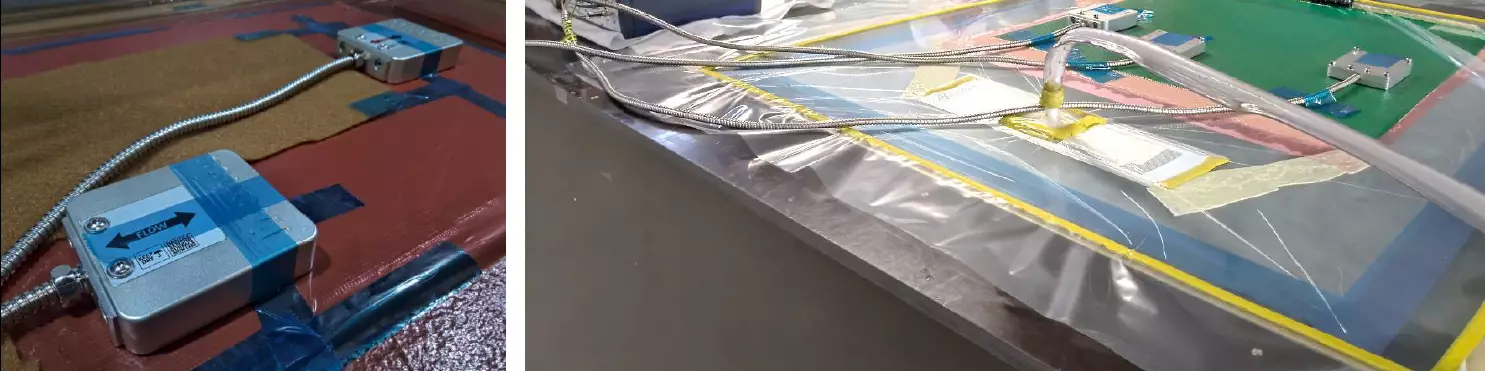
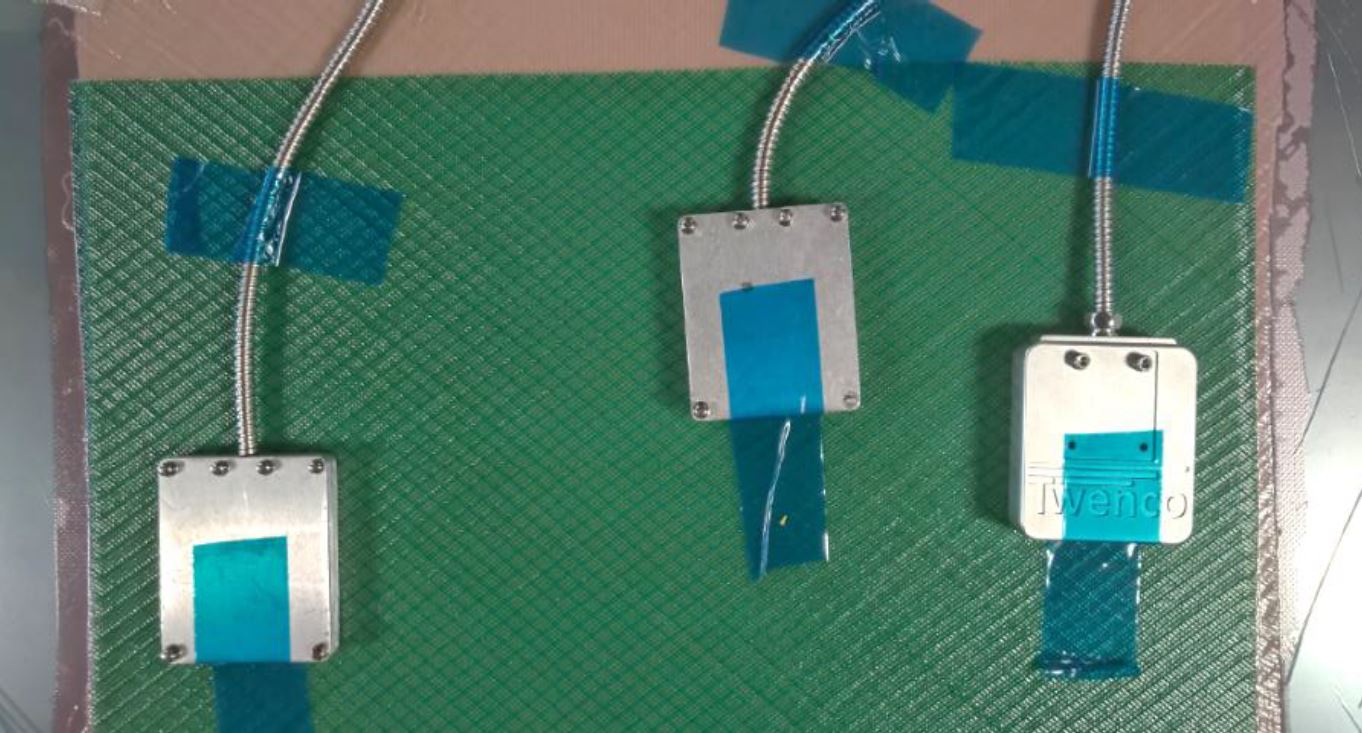
The image above shows a test plate made to prove it was possible to both heat and monitor the composite during resin infusion — a first step toward a “smart mold”. “We integrated sensors with the heating wires to embed them in a glass fiber composite laminate,” he explains. “You start with putting one or two layers of glass fiber, apply sensors on top and then do your first infusion. Then you apply your tracing [resistance] wires and do your second infusion. The sensor has thus been embedded and integrated into the composite mold.” Why perform multiple layers of infusion? “Because you have to fixate the tracing wires, and that's impossible on just glass fiber,” says Boksem. “So, you do the first infusion of, say a 10-millimeter-thick laminate, and then you apply the tracing wires and do a second infusion. This is a standard procedure for composite molds used to make wind blades.”
Non-invasive DEA sensor
The sensor that Twenco embedded into this first test plate has evolved significantly since 2015, but is based on DEA, with an interesting difference. CW has written about other companies supplying DEA sensors, including Lambient Technologies (Cambridge, Mass., U.S., see “Combining AC and DC dielectric measurements for cure monitoring…” ) and Synthesites (Uccle, Belgium, see “DC dielectric sensors for industrial composites production”).
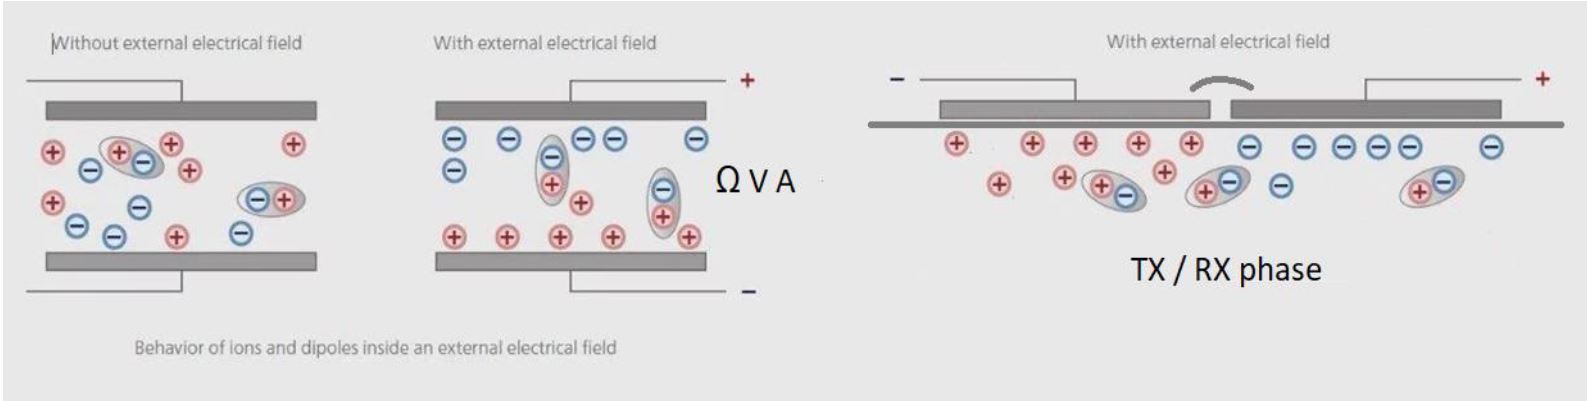
The principle of dielectric analysis (DEA) as it is applied by Twenco, using non-invasive sensors to transmit (TX) and receive (RX) radio signals and measure the near field disturbance caused by ion behavior in the resin or polymer matrix being monitored.
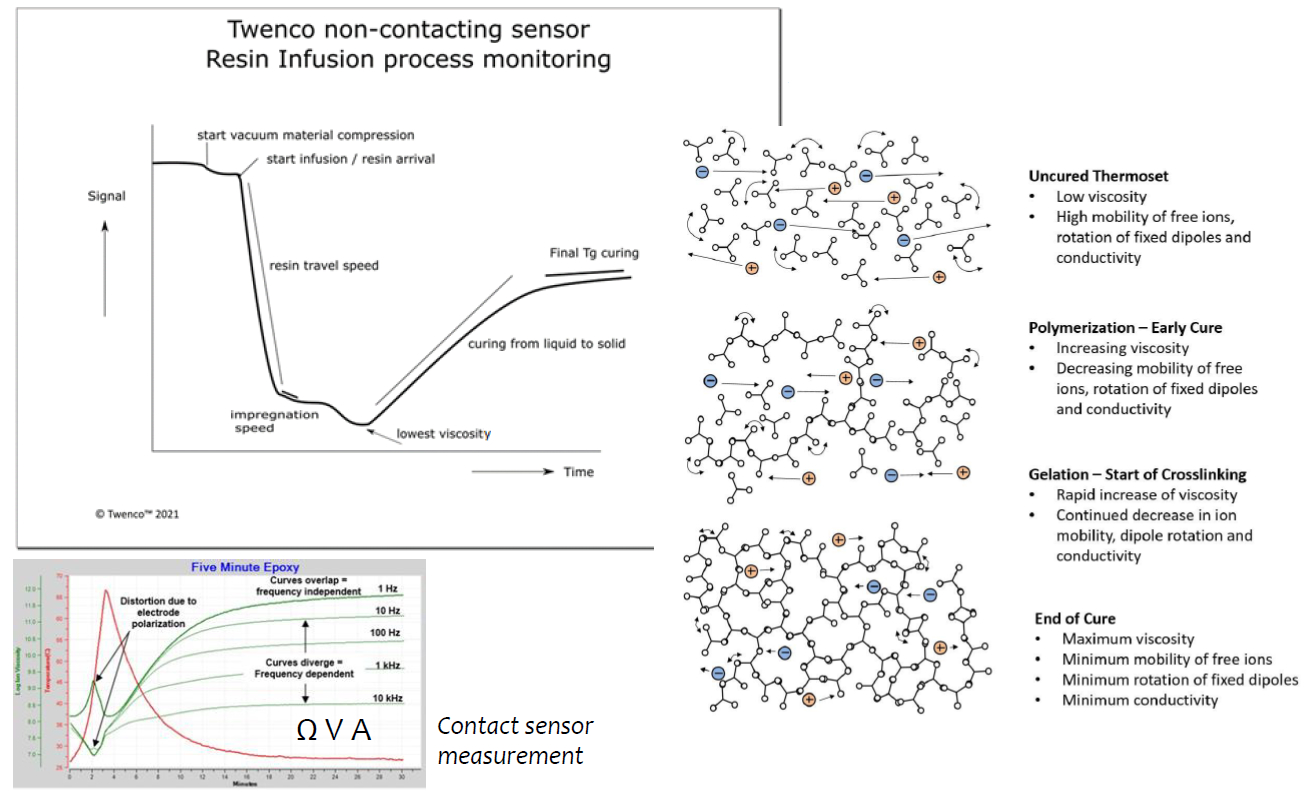
The basis for Twenco’s non-invasive sensor for resin infusion process monitoring.
“Such companies have applied a voltage and then measured from point to point in the laminate, looking for changes in the resin’s electrical behavior,” says Boksem. “They can measure the change in electrical current and calculate the resistance force in the resin. We also apply a voltage, but in addition we transmit and receive a radio signal and measure the near field disturbance caused by the ion behavior in the resin or polymer matrix. So, our RF (radio frequency) technique still measures the ion and dipole mobility in the matrix but also has a high-end behavior/high-frequency segment, and we can detect what disturbs the RF signal, such as damping inside of the composite. This is why we call it an NDT dielectric analyzer.”
The graph above describes the sensor as non-contacting. “Our sensors don’t have to contact the polymer in the composite,” Boksem explains, “and there may be vacuum bag material that sits between our sensor and the part/process being measured. However, a better description is non-invasive, because the signal sensitivity decreases with distance from the product/process. Although we can measure the resin flow or curing process from 10 millimeters away, there is a lot of damping in the measurement signal. Preferably, the sensor should lie on top of the part or be embedded in the mold, where they are typically 0.5 to 1 millimeter beneath the mold surface. The limits on distance depend on whether the material is electrically conductive and the type of process data you want to capture.” He explains that in a composite that is not electrically conductive, using glass fiber-reinforced polymer (GFRP) for example, “we can measure at a distance of 1-10 millimeters. For detecting resin arrival only, this can be up to several centimeters. In electrically conductive materials like carbon fiber, we prefer to be as close as possible to the top of the vacuum bag — 1 to 5 millimeters, depending on the damping reflection.”
“Most importantly, the sensor must be in a stable position,” he continues. “If the sensor moves, there can be a signal disturbance, because the distance to the surface is changing. Note, a fabric has never a 100% flat surface.” There are two other key aspects that Boksem points out. “One issue we find with measuring voltage, current and/or resin resistance between two points is that it limits the ability to measure through the thickness or depth of the part. Also, issues with signal damping can pose limitations on detecting the final Tg level at the end of curing.”
Sensor evolution
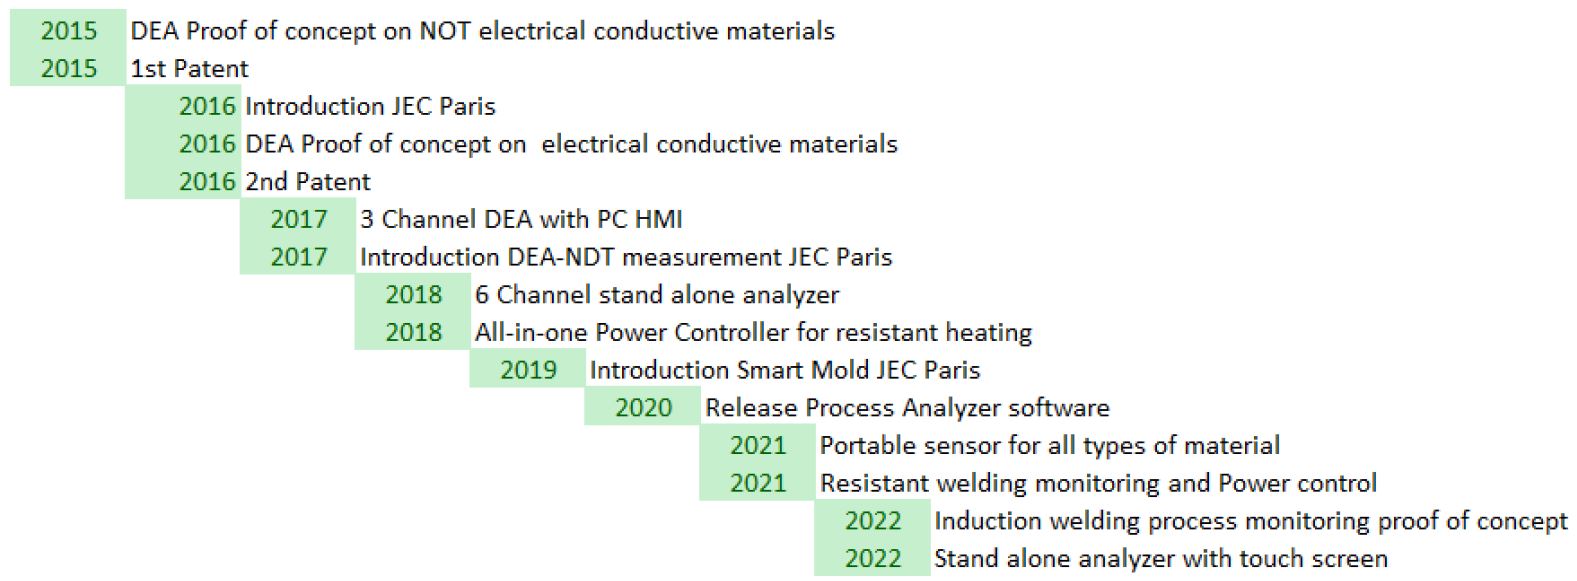
Twenco patented the algorithm behind the sensor in 2015 and introduced it in 2016 at JEC World in Paris. “We did not sell the technology,” says Boksem, “but instead wanted to gather all the problems companies are having in composites processing and to find partners.” The company succeeded on both counts, including work with the Netherlands Aerospace Center (NLR, Marknesse).
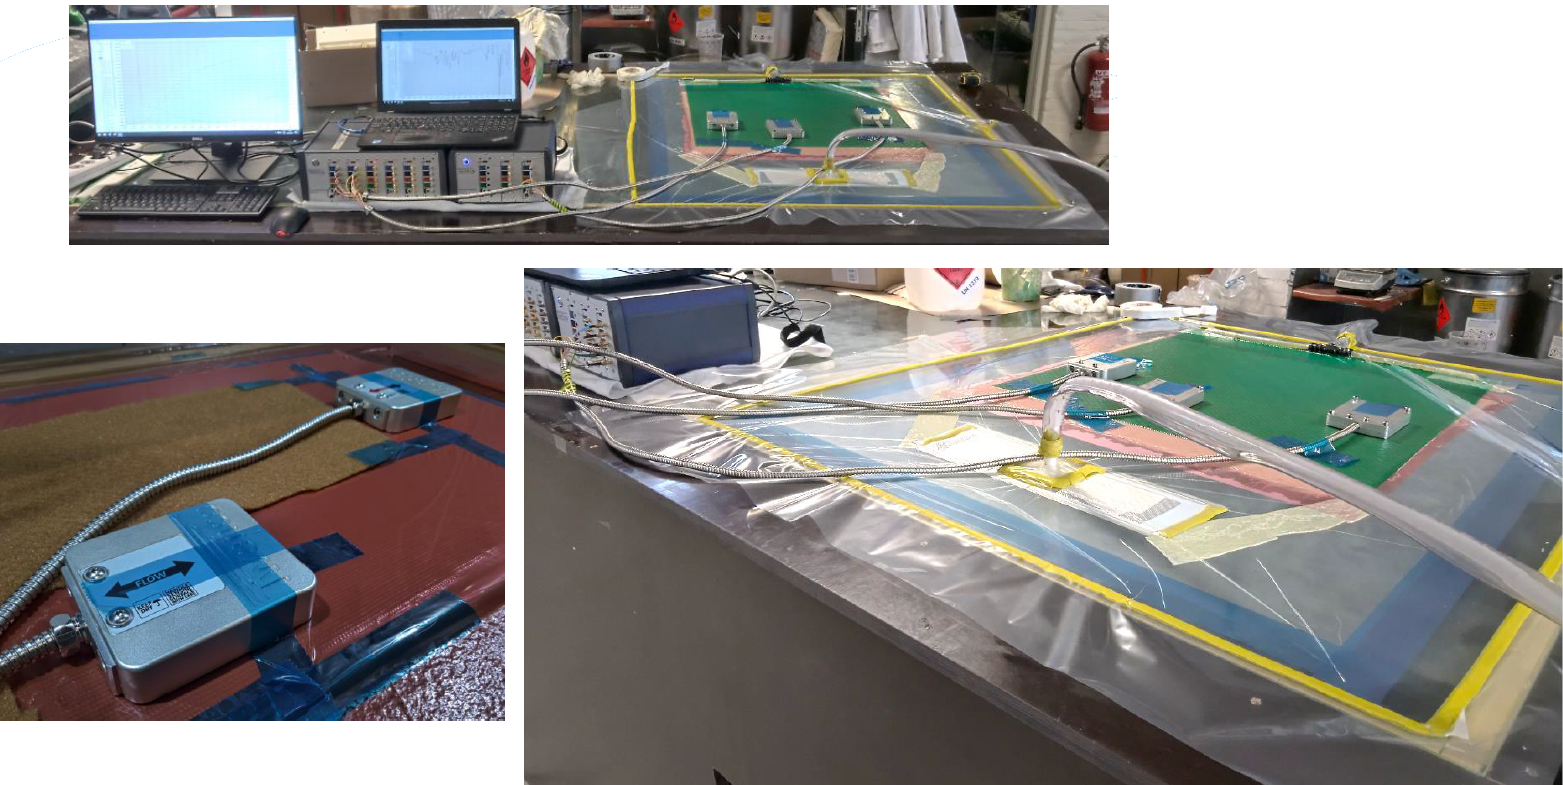
Twenco sensors on top of vacuum bag in resin infusion trials.
After successful tests with glass fiber composites, Twenco began trials with carbon fiber laminates and ran into problems. “The electrical conductivity of the fibers interfered with our ability to measure with the sensors,” says Boksem. “So, we had to make a new sensor and new trials to prove our ability to detect process behavior even with carbon fiber.”
Twenco applied for its second patent in 2016 and continued development. “We attended JEC again in 2017 to show that with our technology it's also possible to find material defects,” says Boksem. “We again collected problems from the industry and used that information to improve our dielectric analyzer, but still not selling it commercially.”
Now, Twenco could finally proceed with its idea of a smart mold to see what is happening in the process. “We combined it with mold heating, but with a difference,” Boksem explains. “Up until then, if you had a multi-heating system, you would buy the components, put them together and then make your own software in order to control it. And I thought, it's so complicated. Instead, I could make one module where you can directly connect your thermocouples to detect maximum and minimum temperature. The other flexibility I wanted was to run with 24 volts/single phase and 450 volts/double phase, so that you can control whatever equipment you want to connect to it. In other words, whatever the resistance is, it should work and should automatically calibrate the maximum power. It must be plug and play — just put an ethernet cable on and it's working.” This design, he adds, would also let customers update firmware on multiple modules with one mouse click.
“We showed this system at JEC 2019,” he continues, “with integrated sensors and heating.” It was also used in the InHolland student project called “First time right”, to develop automation of the vacuum infusion process for small series production of composites (see video below).
“In this project,” he continues, “Twenco worked with Polyworx (Nijverdal, Netherlands), a supplier of resin infusion and resin transfer molding (RTM) simulation software, to introduce a smart mold that showed both resin flow in the mold as well as cure behavior. We could also see vacuum leaks with the sensor as a result of fiber decompression behavior,” says Boksem.
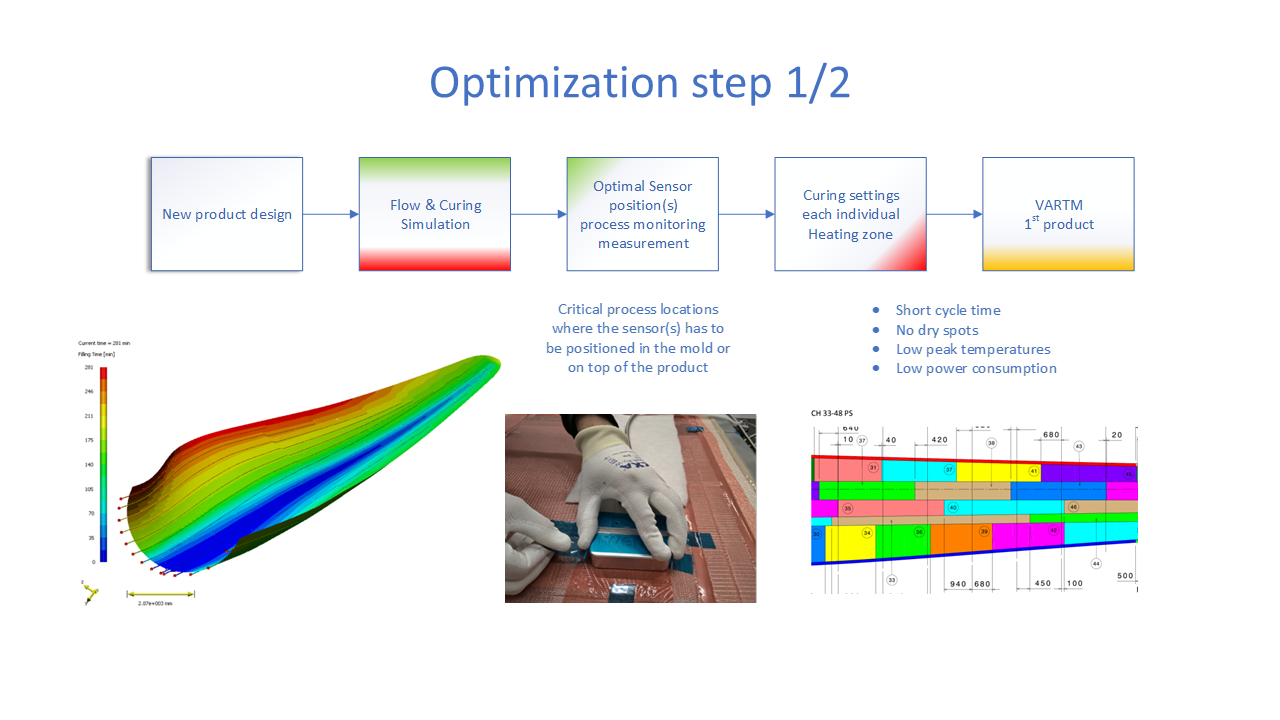
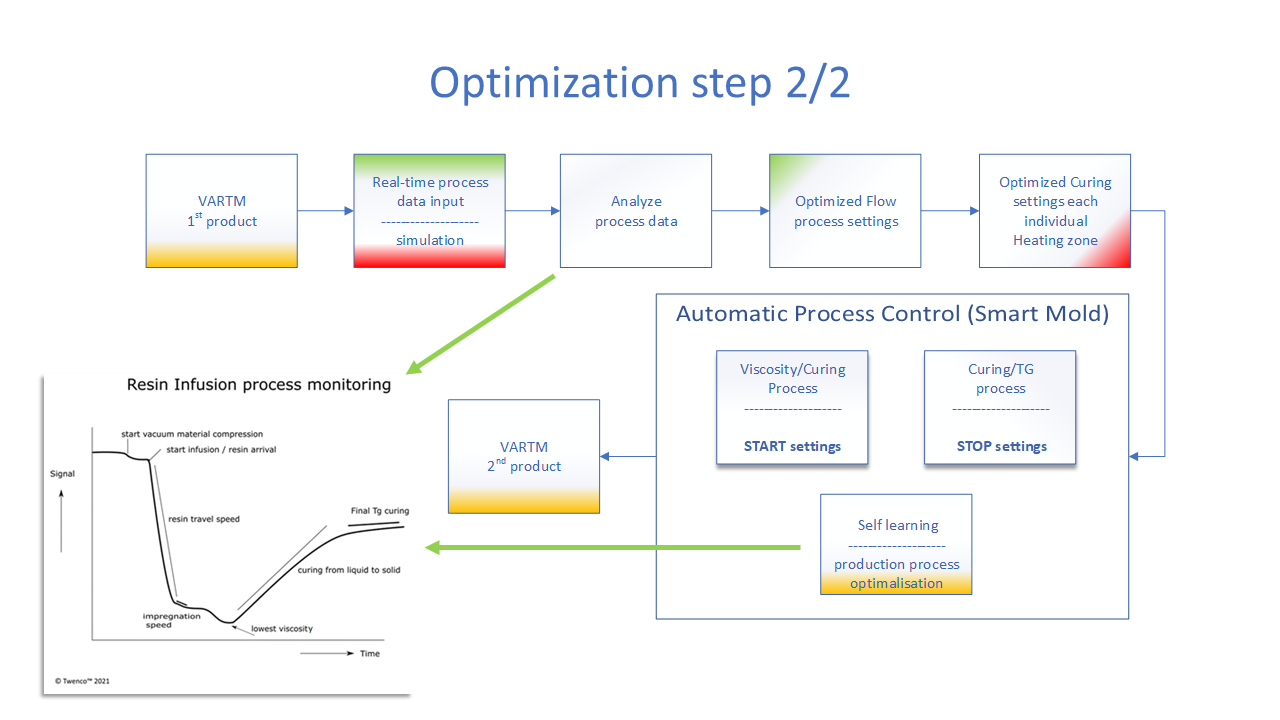
“After JEC 2019, we continued optimizing the smart mold idea by combining sensor data with flow and cure simulation into a tool for optimization of the VARTM [vacuum-assisted resin transfer molding] process,” he says. “Our aim was to get a new product into serial production in a fast and controlled way. We have a plugin to export our data directly to the simulation software, in order to do real-time recalculation. Polyworx has been a key partner in this.”
Continued evolution, software simplicity
In 2019, Twenco installed at the Delft University of Technology (TU Delft, Netherlands) an infusion test table with six heating zones and six embedded sensors. “Just last month, we updated the firmware and software to our latest release,” says Boksem. “The students will use this VARTM test table to validate their process simulations and gain knowledge on how to optimize infusion and curing processes.”
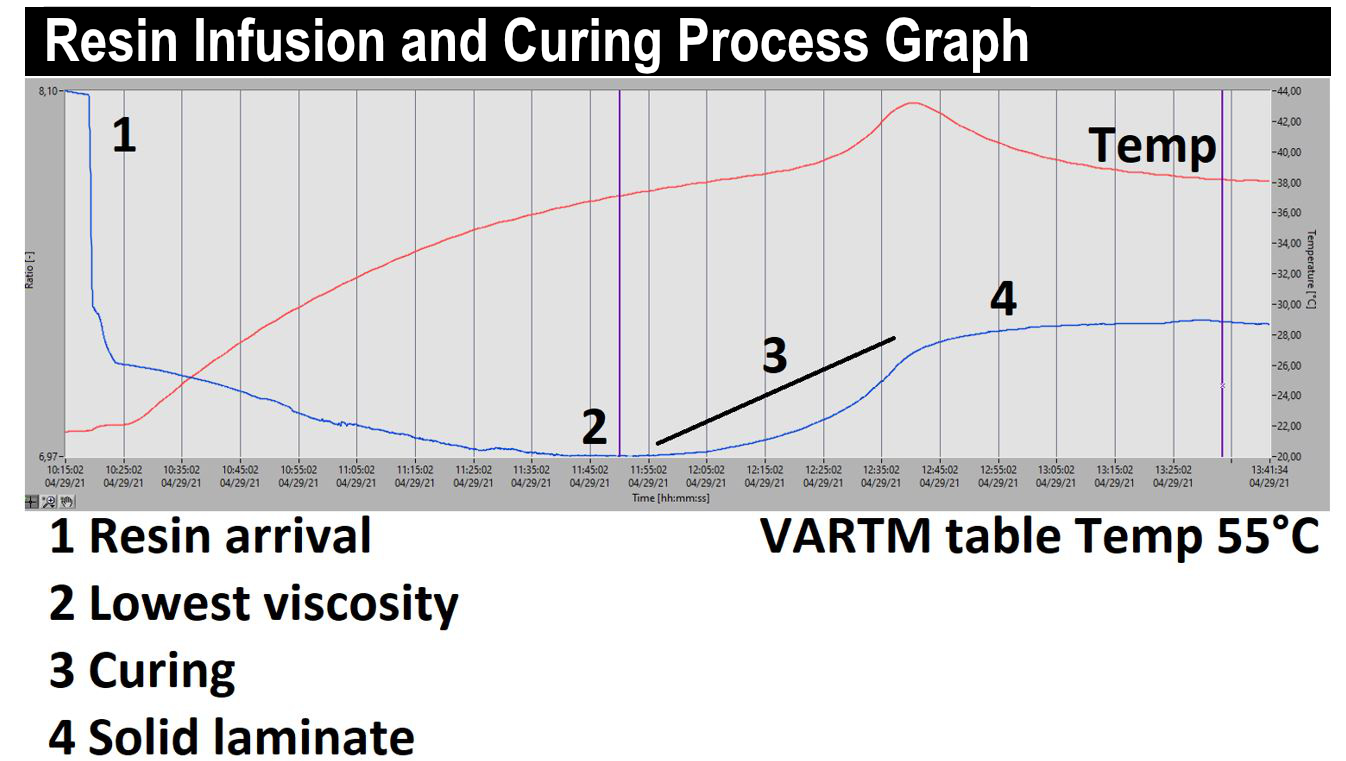
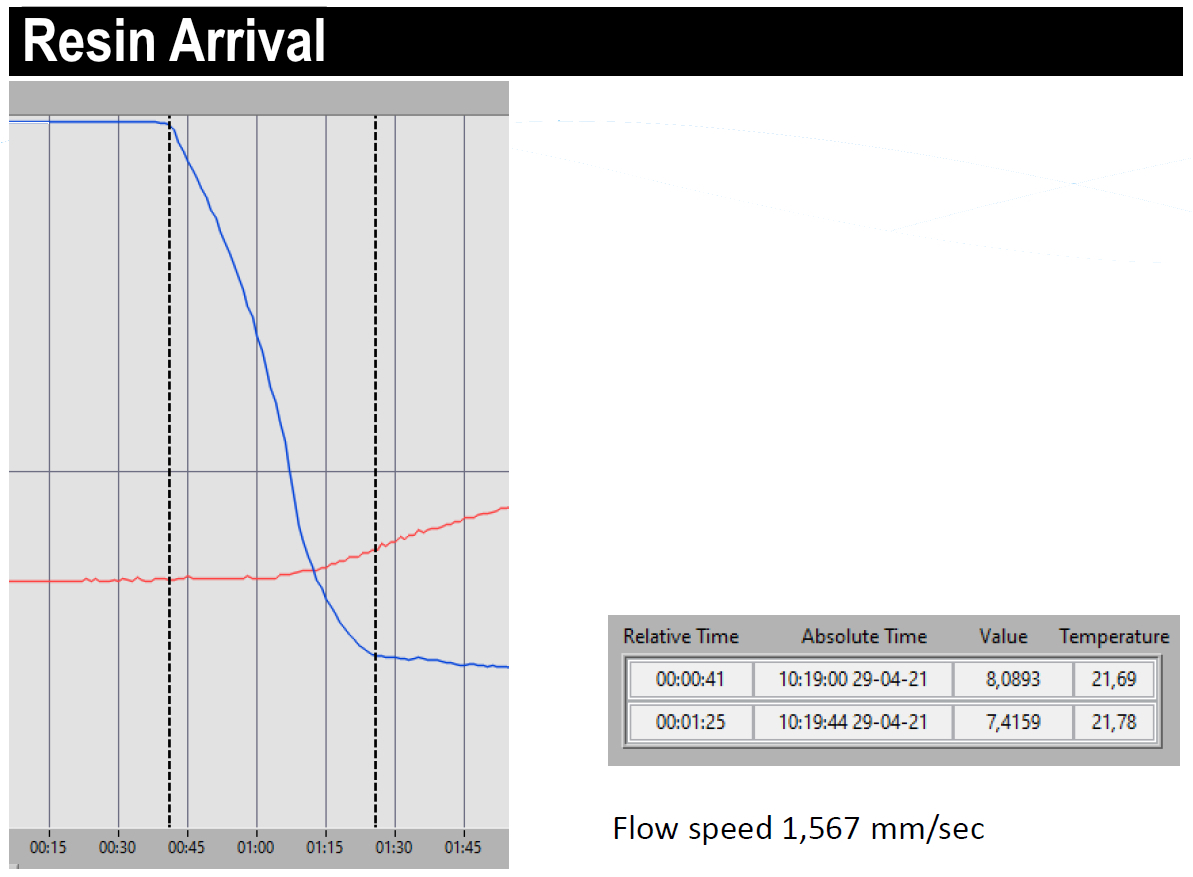
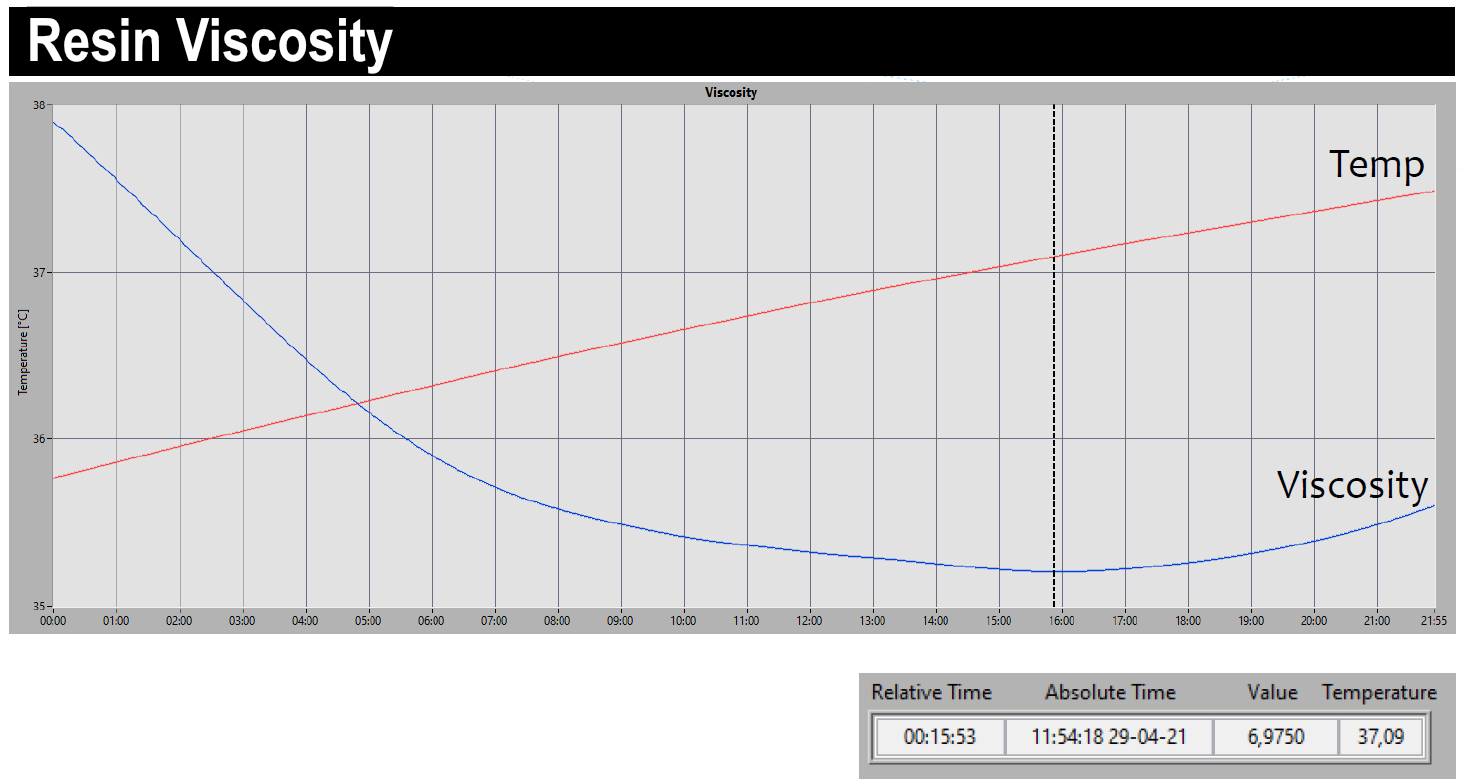
The graphs above show data captured by Twenco sensors during resin infusion.
The measurements shown here are examples of what the students will be able to see using Twenco’s sensors and DEA analyzer. They were made with samples using glass fiber and Elium liquid thermoplastic resin for infusion from Arkema (Colombes, France). “The temperature curve shows the ramp and then a small exotherm peak at the end,” he continues. “The idea was to show resin arrival, viscosity and curing/cooling into a solid state. We could also see the resin arrival during infusion and then calculate the flow speed. It is also nice to have the simulation software, so you can compare your calculations with what is achieved in actual processing.”
“If we calibrate for the resin system, the same as Synthesites does, then we can also predict the final Tg and degree of cure,” says Boksem, “and thus, pinpoint the end of the cure cycle. Apart from DEA, you also need software that can analyze and compare measurements that you did before. The idea is to go quickly from raw data to a report in less than 15 minutes. But in the beginning, our software was so complicated, really just for smart engineers. And that is impossible to sell. Now, however, we can put a sensor on top of the material, you push the start button to calibrate, it calibrates automatically and then you measuring starts — that's it. You still have to know what you're doing, but it’s much easier to learn and use the system.”
Twenco made this new analyzer software in 2020, and then in 2021, developed a hybrid sensor to use with both glass fiber and carbon fiber composites. Before, it had separate sensors for electrically conductive vs. non-conductive fibers. “We wanted one sensor that fits all,” Boksem explains.
Sensor size, temperature and cabling
Though Twenco does make 1-inch-diameter sensors, which are more akin in size to those supplied by Netzsch (Selb, Germany), Lambient and Synthesites, Boksem says Twenco’s standard sensors are 9 x 10 centimeters. “We use an aluminum housing to add some weight, which helps to prevent movement and interference with signals,” he explains. “But we can also make the sensors much larger, to see what is happening in the material over a larger surface.” Why are the sensors cabled? If they use RF, couldn’t the data be sent wirelessly? “It’s due to temperature,” says Boksem. “For infusion, the sensors could be heated up to 200°C, and that’s a real problem for wireless electronics. They can go up to perhaps 80°C, but for a 200°C or higher environment, the sensors must be cabled.”
Resistance welding
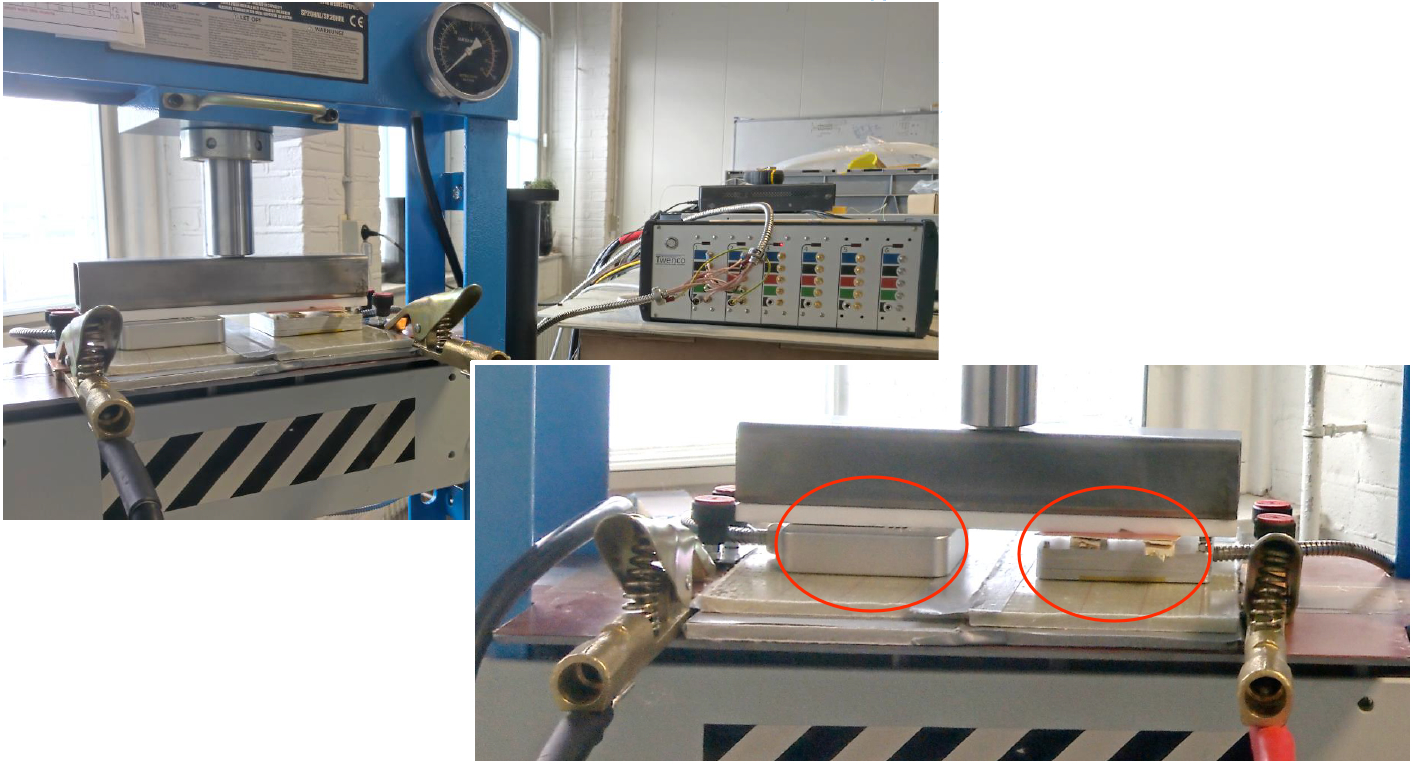
Resistance welding test setup with Twenco sensors placed on top (circled in red).
Twenco has also demonstrated its sensors with thermoplastic composites welding processes. “We started working with resistance welding in 2021,” says Boksem. The test setup (see image at right) used top and bottom plates made from glass fiber-reinforced Elium thermoplastic resin with a metal mesh in between. These plates were made from scrap laminates from infusion trials, he explains, so they were duct taped together. The weld line stretched from left to right with two Twenco sensors (red circles) placed above it on the top plate. Electrical current was supplied to the metal mesh through jumper cables, and the resistance to that current flow heated the material in the weld zone.
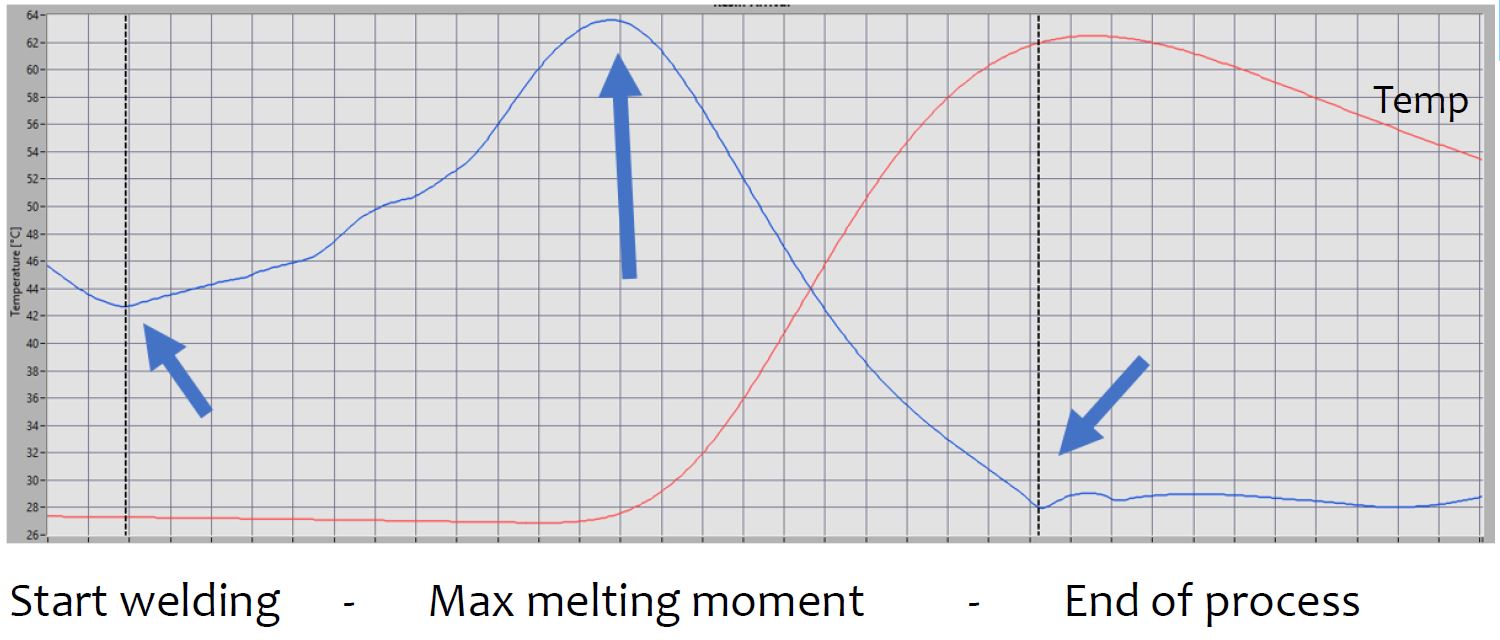
Graph of signal amplitude (blue) and temperature (red) data during resistance welding, obtained from Twenco sensors on top of 8-mm-thick glass fiber/Elium laminate.
The Twenco NDT Analyzer can be seen in the upper right of the photo above. “There is also a laptop connected to receive the signals and run the analyzer software,” says Boksem. In this graph of signal amplitude (blue) and temperature (red) vs. time, he explains, “you can see the start of the welding process and the increased melting [ion/dipole movement] in the weldline. When the signal amplitude is highest, you have reached the point of maximum melting, and when it is the lowest, you have reached the point at which the melt has stopped, the material is solid and the weld is completed.”
But why is the temperature highest at the end of the welding? “The temperature is delayed because we measured it from the top of the plate surface,”explains Boksem. The Twenco sensor can measure the material dielectric behavior in the weldline, but its temperature sensing component is at the surface. “The laminate was eight millimeters thick,” he adds, “so we had eight millimeters distance from the middle of the weld to the top surface.”
Optimizing viscosity vs. power
In the graph below, Twenco looked at viscosity behavior (red) and power (black) versus time. The left axis shows the ratio of input signal (RX) to output signal (TX) and the right axis shows power input for welding. Each vertical line in the graph represents 60 seconds. “We transmit an RF signal into the material and compare that with the signal we received back to measure the damping from the material. The change in ratio is a result of the signal damping inside the material,” says Boksem. “As the matrix melts from solid to liquid, there is more damping, which decreases the signal amplitude, and thus, we can calculate the change in viscosity.”
In the graph below, there is maximum signal damping when the matrix polymer is at minimum viscosity, says Boksem. “The maximum melt is the horizontal line that is stable during the hold at 200 watts. At the end of this, we switched off the power, and the ratio signal goes up, as the material starts changing to a solid.”
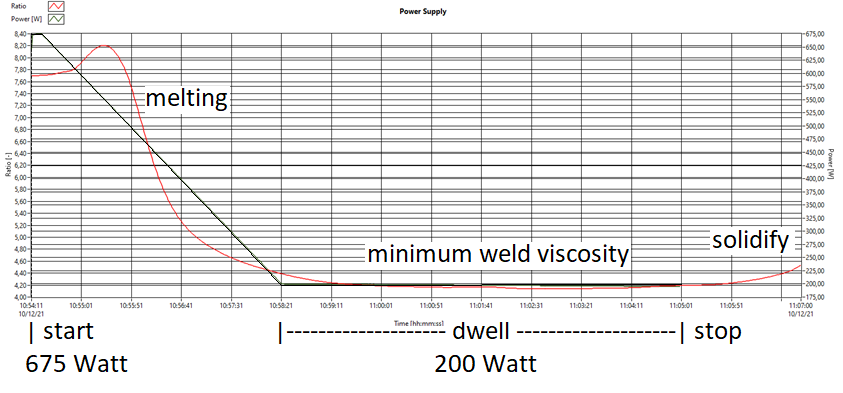
Resistance welding trial, graph of viscosity (red) vs. power (black). During hold at constant low power, the viscosity is stable.
The goal of this test was to explore how to optimize power for a targeted polymer viscosity. “If we know the point of minimum polymer viscosity,” he posits, “then how much heat and corresponding power is required to hold this? The idea was to see if we could sustain maximum melt with only 20% of the heating power. If so, then we can save energy, and also avoid too high of a welding temperature.”
“We started with 100% power using 675 watts and decreased that to 200 watts,” Boksem continues. “We could see that we were still able to melt the resin and hold it exactly stable. And now, instead of doing this manually, we could do it completely automatically by developing an algorithm based on the viscosity curve. If the slope of that curve is, say 45 or 30 degrees, then reduce your power. And we could also say, ‘hold that power and temperature stable for 10 seconds and then stop’. So, you can automate the process, assure that your weld is good quality and use this graph as proof.”
“You can also trigger a reduction in power at the moment the melting starts so that you can reduce the maximum temperature,” Boksem continues. Why do this? “Because there were some smoke fumes when using high power and that's not what you want,” he explains. “By reducing the power, we could also reduce the smoke emissions. Of course, we extended the time, but it was more just to see if this was possible to control as well. This is something that is difficult to do with temperature sensors outside of the weld, but you can do it in this way.” Why? “Because what you’re seeing here is real viscosity and it’s not just looking at the temperature and saying, ‘okay, we know that if the temperature is this, then inside of the weld the viscosity should also be stable.’ Because even if you know the temperature, you don't actually know if the material viscosity is still fluctuating and for how long.”
The concept then, is that Twenco is actually looking at the material state of the polymer within the weld? “Yes,” says Boksem, “and this is important because just making the weld time longer does not help. We can find exactly the point at which the maximum melt has been reached and crystallization must begin with cooling. Once you can pinpoint the crystallization along with this viscosity behavior, you have all you need.”
Twenco will resistance weld a 3-meter-long demonstrator this year. “The final goal,” says Boksem, “is to make a weld 50 or 100 meters long, where we can see the viscosity behavior of the polymer within the weld and use that to control the heating and welding process.”
Induction welding
“We actually did a test in 2016 using inductive welding,” says Boksem, “but I got so much disturbance in the magnetic field that it was impossible to measure anything. However, since that time, we have made a lot of improvements. And beginning this year, we did a first proof of concept to see the viscosity behavior in the matrix during induction welding.” This latest testing used 1.5-millimeter-thick test plates made from carbon fiber-reinforced polyphenylene sulfide (PPS).
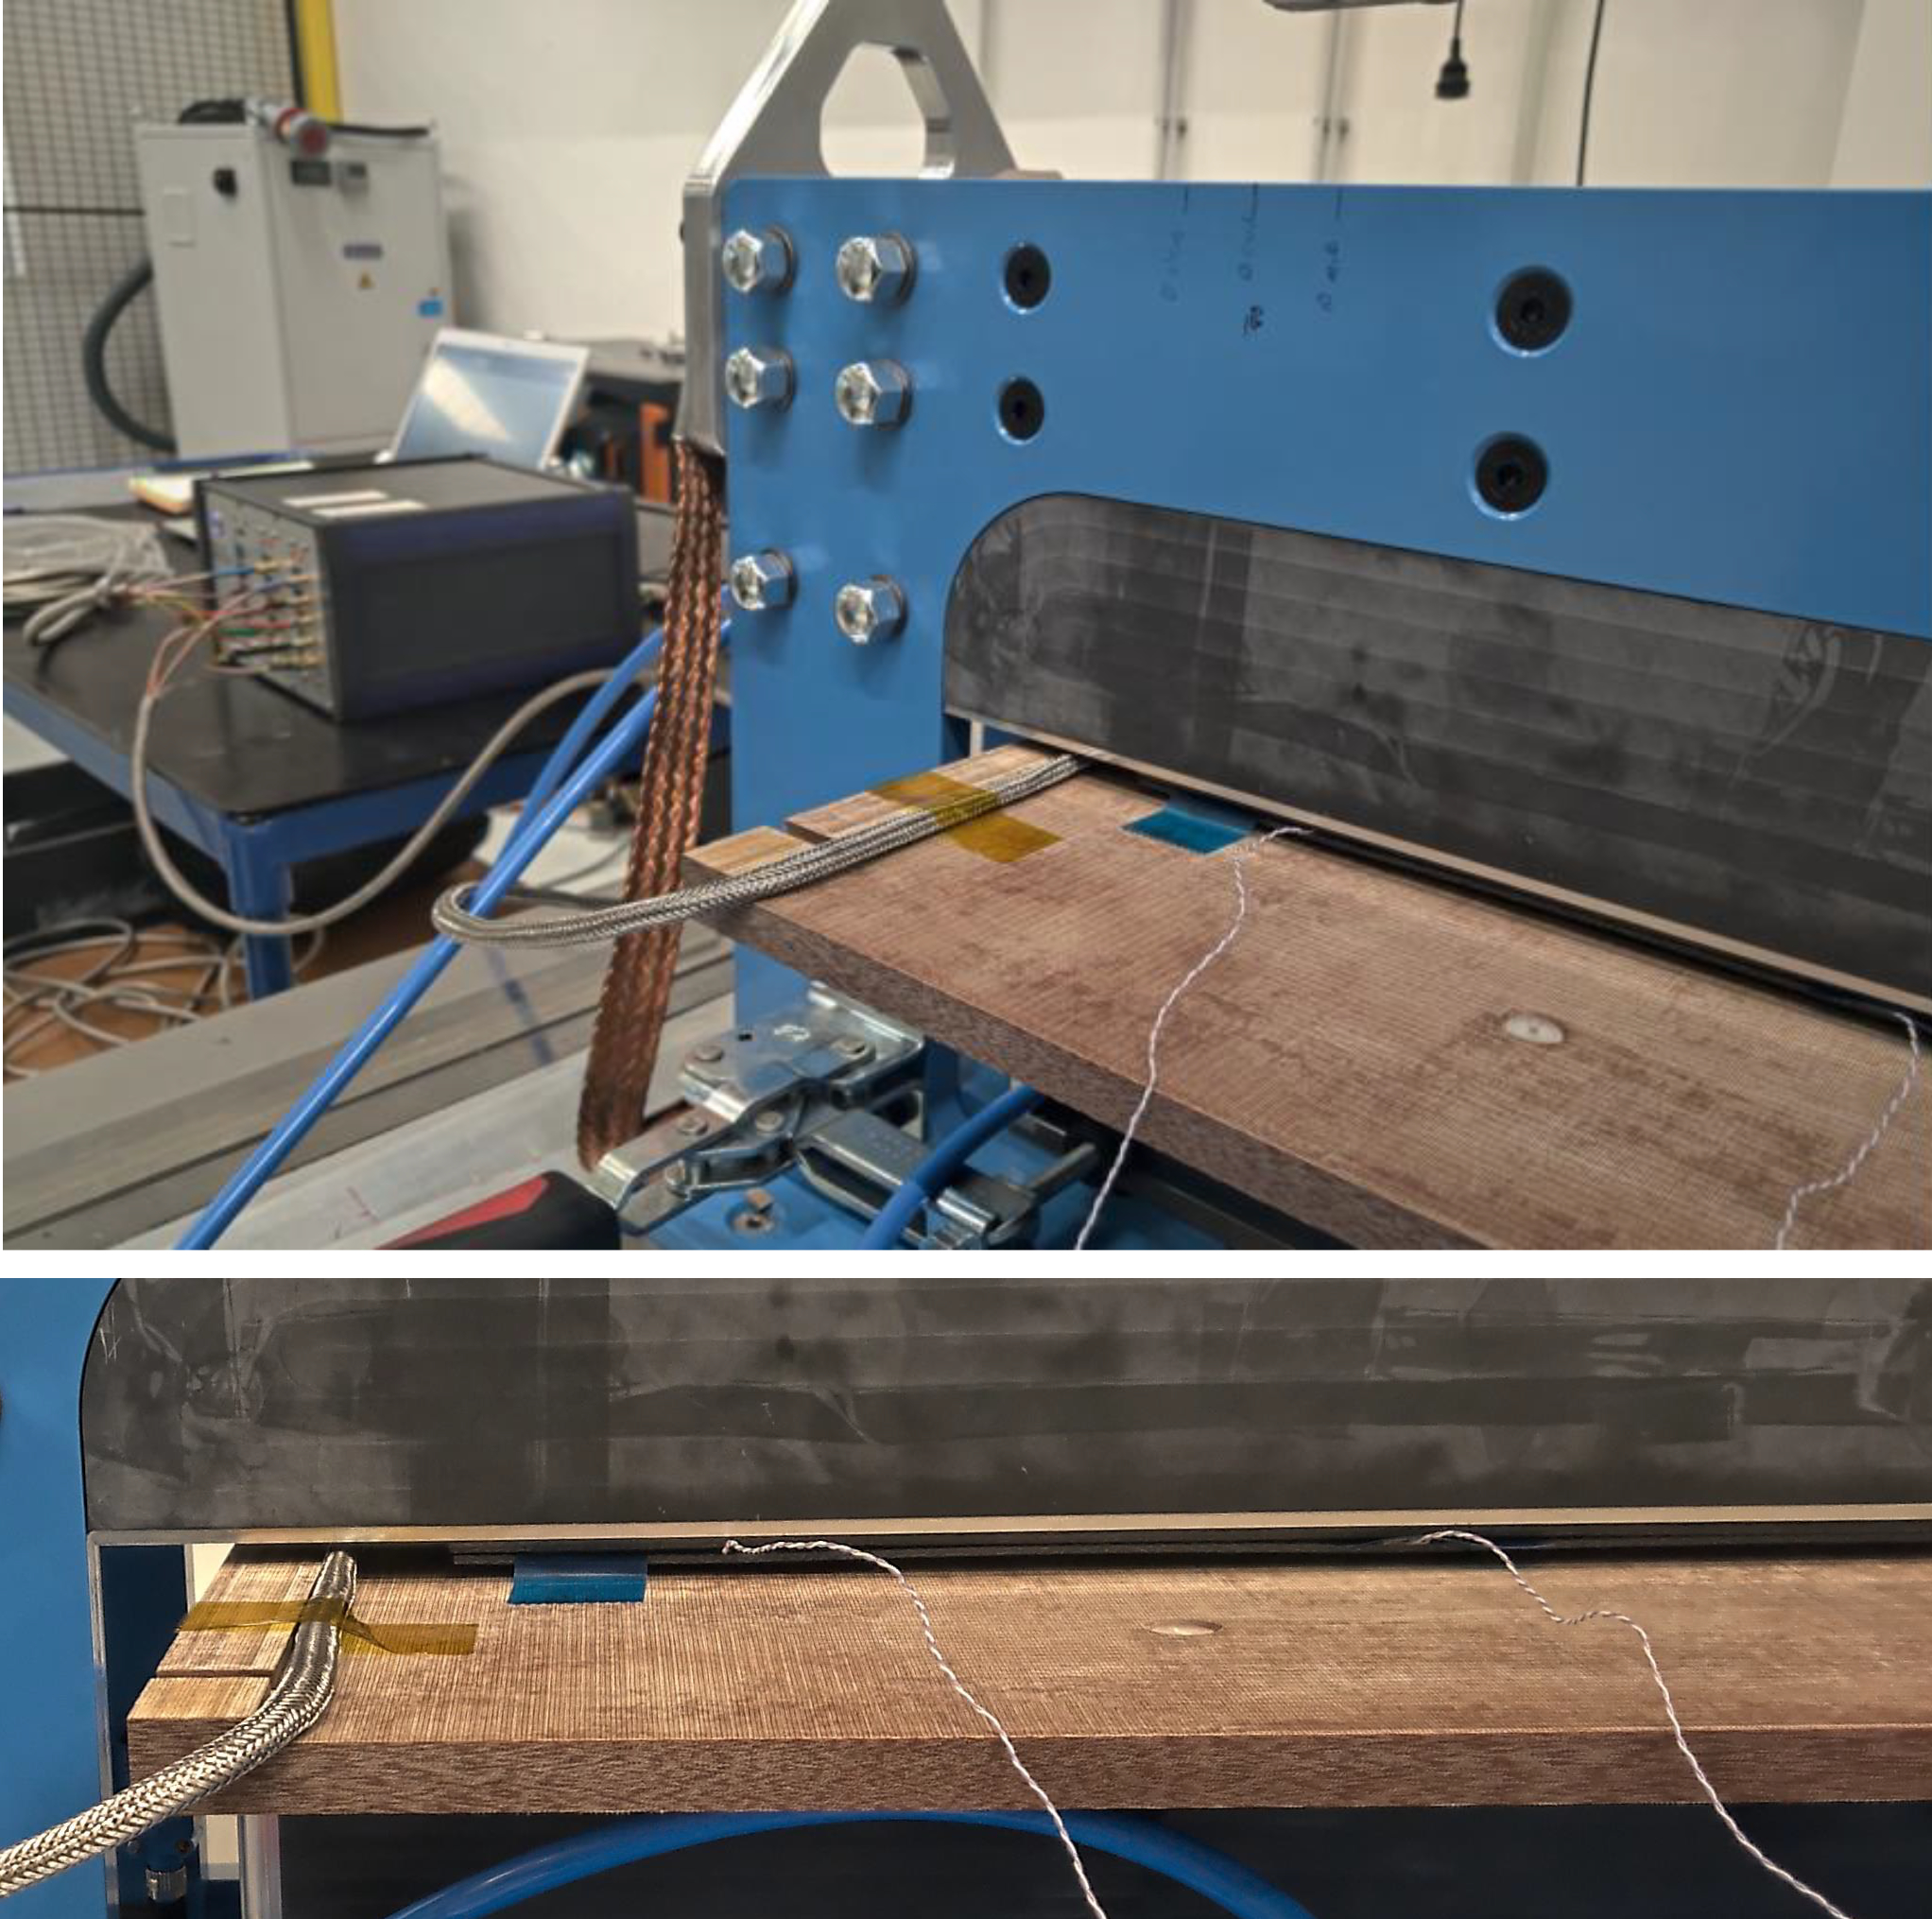
Twenco induction welding trial using KVE standardized welding test setup.
The image at left shows the dynamic welding test setup developed by KVE Composites (The Hague, Netherlands) that Twenco used for this most recent test. “The base plate is a proprietary phenolic material from KVE,” says Boksem, which tolerates the high temperatures (≈300-400°C) during welding but without the potential induction issues from materials such as magnetic stainless steel or carbon fiber, which can generate electric current. “Our shielded sensor cable can be seen on the left, and two cables from thermocouples are to the right,” he continues. Two CF/PPS plates were welded together with the Twenco sensor placed on top of the upper plate.
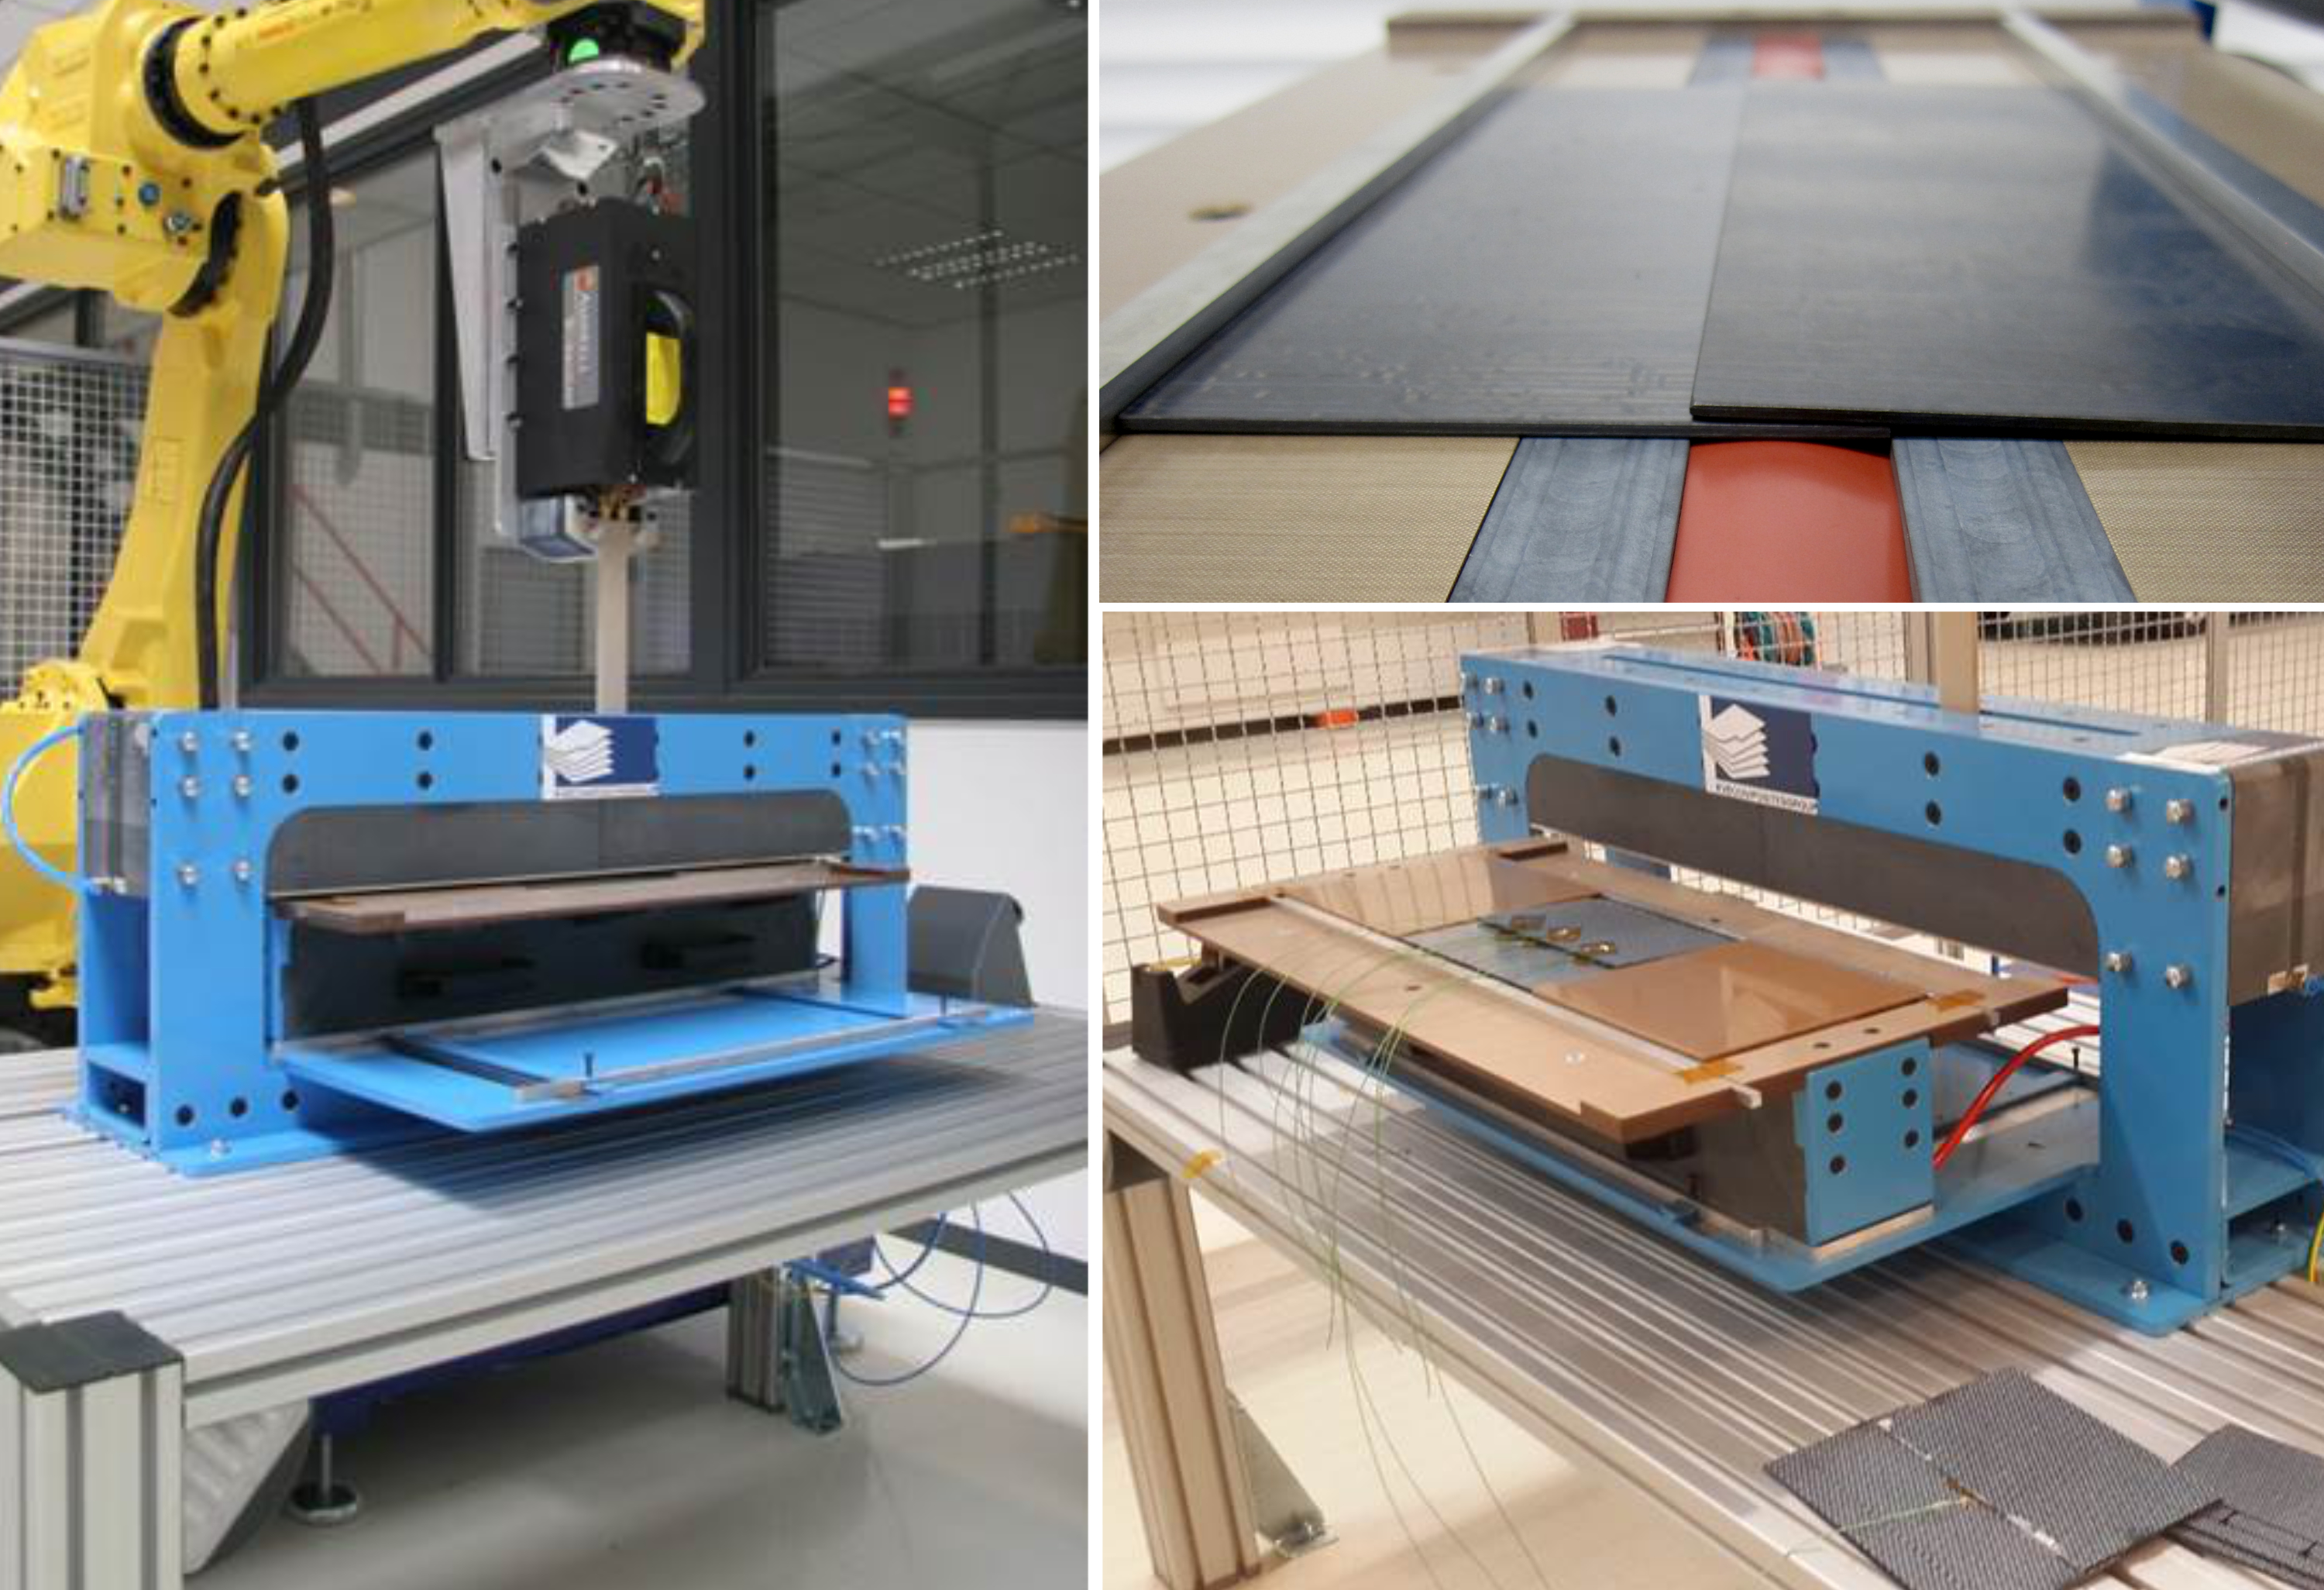
KVE Composites has developed a standardized induction welding setup to support process qualification at OEMs and Tier 1 suppliers, which produces single-lap shear coupons (top right) as well as L– and T-stringers. Photo Credit: TPRC and KVE Composites, “Welding thermoplastic composites”
“In addition to the surface temperature measurement, we put thermocouples in the weld line to measure the temperature in the weld,” Boksem explains. “Then we applied pressure, as is required during welding, and we could see this with our sensor.” (See “CLAMP” at left in graph below.) Welding began as the induction coil, positioned by a robot a few millimeters above the top surface, moved along the length of the weld from left to right, in a slot behind the blue and black face plate.
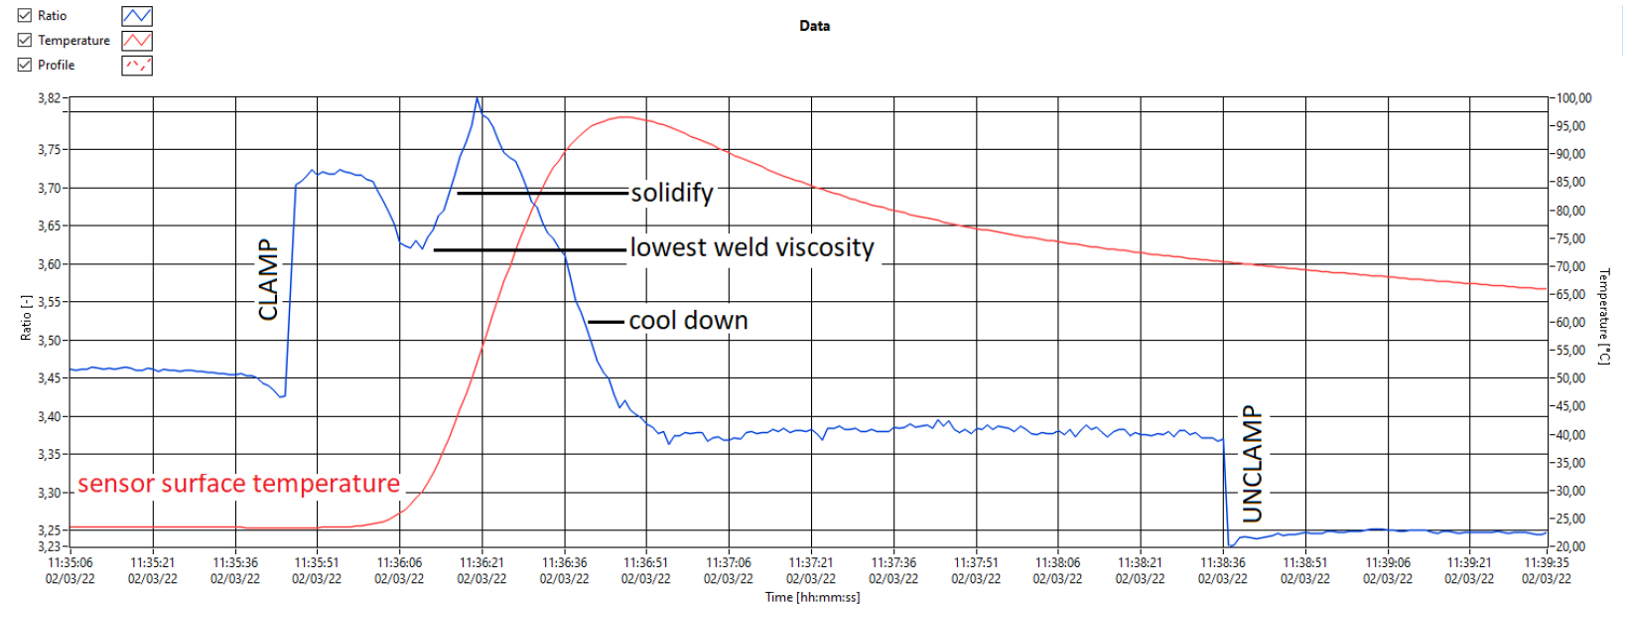
Graph of Twenco DEA sensor data — ratio of RX/TX in blue, temperature in red — during induction welding composits test.
As it did in the resistance welding tests, Twenco again measured the change in viscosity via ratio of RX/TX and temperature from the sensor location on the top plate surface. The point labeled “lowest weld viscosity”, he explains, “is the moment that the induction coil is moving over the sensor, the temperature inside the weld is maximal, and the melting is occurring. We also measured the surface temperature, but there was a delay, because the heat is at the weld line, in between the two laminates. So, it takes a couple of seconds to reach the surface. However, from the additional thermocouples we placed in the weld line, we could see the temperature reaching toward 300°C to melt the thermoplastic matrix.” The latter is not shown in the graph above.
The graph below zooms in to the lowest viscosity point during the induction welding trial. “Our sensor had no direct contact with the CFRTP plate being welded,” he notes, “yet it provided visibility into what was happening inside the weld, and you can see that this maximum melting was stable for five seconds. With a few tests, you could easily characterize the relationship between weld power and travel speed to help optimize the welding process.”
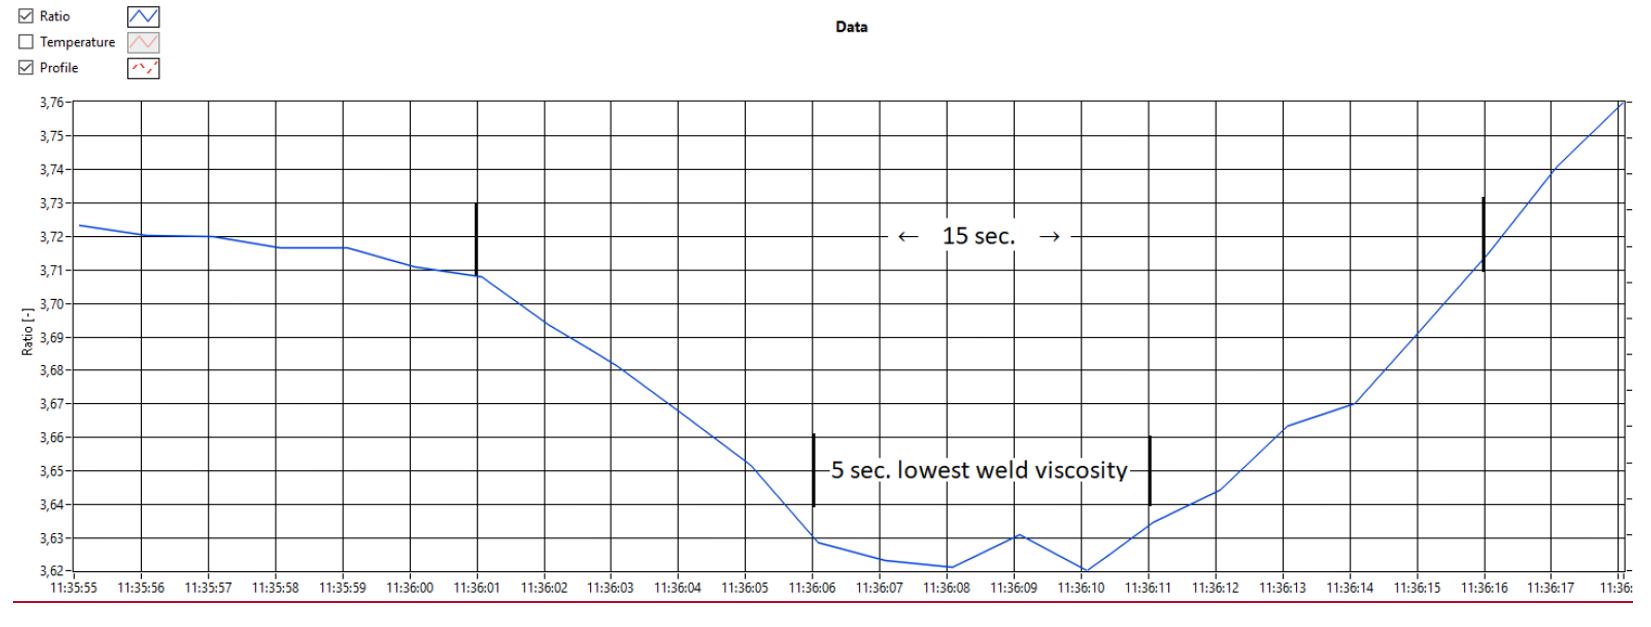
Zoom into lowest weld viscosity point during Twenco induction welding trial.
This was a proof of concept,” continues Boksem, “and we still need a year or so to optimize it, but the signal was very stable; there was no disturbance. So, already that is significant improvement compared to our tests in 2016.” How did Twenco solve the previous issues? “We made significant changes in the electronics design and also isolated the sensor using Teflon tape, so that we had no direct contact with the carbon fiber in the plates being welded,” he says.
Boksem notes this process monitoring requires a lot more work to mature. “For example, we need to look at how to maximize the amplitude of the signal. We also have ideas to make a sensor long enough to scan along the whole weld length.” Why not just combine the coil and sensor together in the robot’s end effector? “The movement would create too much disruption in the signal,” he explains. “So, for now, we must use a static sensor.” Twenco has also worked with KVE to monitor crystallization during induction welding. “We could see the viscosity clearly, but it was difficult to also see the crystallization. We could see changes, but the resolution was not high enough. Ideally, you want to see the crystallization form as the liquid polymer turns back to solid across the width of the weld. This is also something we will continue to develop.”
Next-generation sensors
“For me, the work with KVE has been really eye-opening,” says Boksem. “It has shown how much is possible using our technology and that there are many more opportunities.” For example, combining its techniques for scanning during welding and infusion with more conventional NDT. In the images below, he explains, “this is just an overlay using Photoshop, but it shows our idea to make a 2.5D image by superimposing different scans. This one shows some green areas signifying defects where the weld started and then the changing material structure in yellow. And to the right of that image, there are three versions of the same scan with different signal inputs, showing how we can look through the depth of the part.”
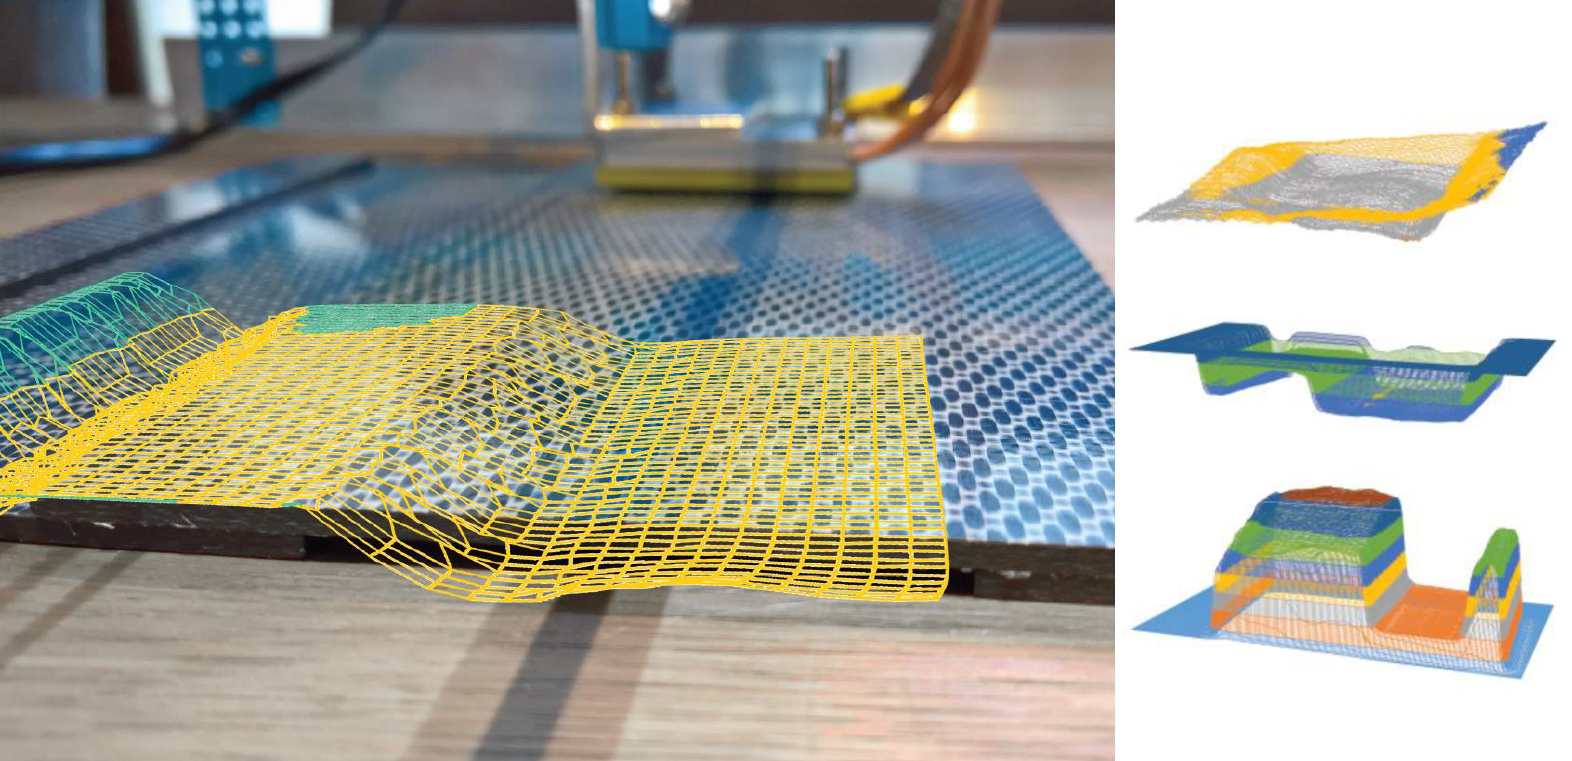
NDT data generated from Twenco DEA sensors.
The first of these three NDT scans show a part in yellow and blue with a gray plastic foil defect that was embedded inside the part on purpose. “We were able to see the foil defect clearly,” says Boksem. “In the others, we scanned the same composite plate with different sensor signal strengths and we get different values. If we put all these values in a graph, you see how the signal is being damped in the material. And that provides a visualization through the thickness of the part.” What do these visualizations tell you? “A defect such as a delamination, air inclusion or dry spot becomes visible because the signal damping is different,” he explains.
Boksem comes back to the idea of large sensors, with many elements, that could be installed in a process line, over a molding station or welding station, for example. “These could take many static scan ‘pictures’ within a few seconds and then overlay them,” Boksem explains, “then you would get the kind of 2.5D images as above, and they could be tailored to look for certain parameters and defects. Placed on top of large parts, this kind of sensor could see how resin is flowing, how it is moving through the depth of the part and how cure is progressing. It’s somewhat similar to how signal deflections are detected by bistatic radar systems that are constantly scanning at airports, for example. And you could put such scan data directly into simulation software to achieve, in real time, better process simulation and optimization, including resin flow and curing.”
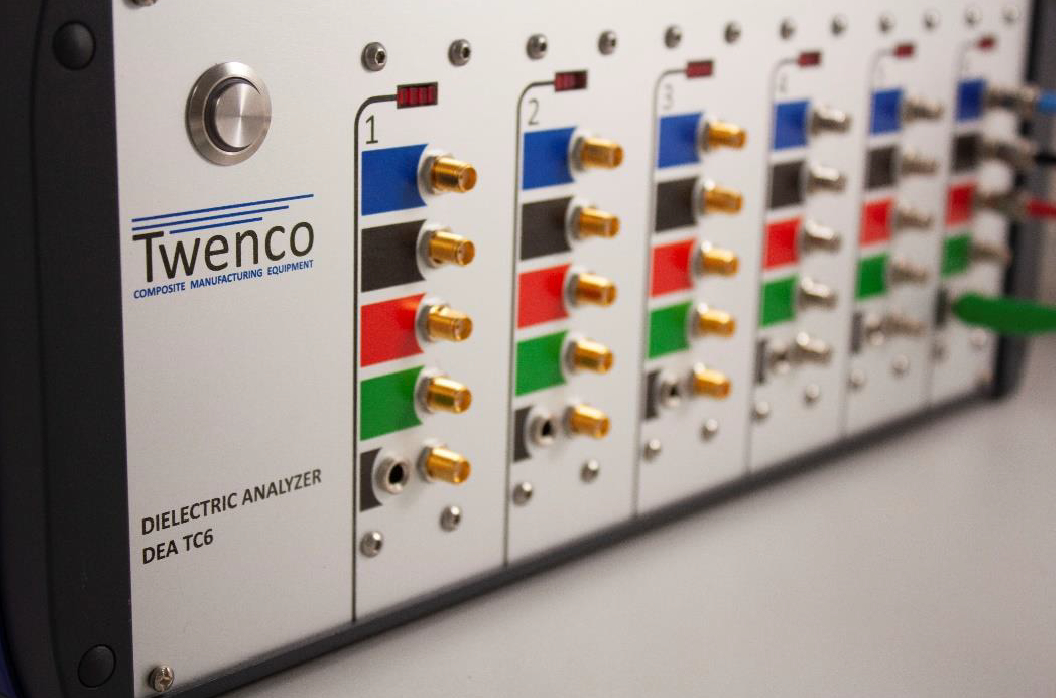
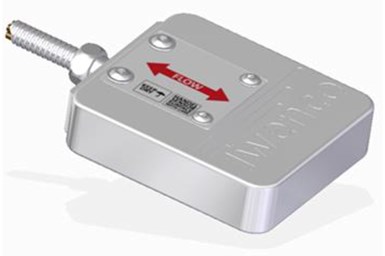
Twenco’s analyzer unit (top) can input/output data from six sensors (bottom).
The other vision that Twenco is pursuing pertains to the NDT analyzer’s ease of use. “We're working on a stand-alone analyzer with touchscreens so there is just one box connected to whatever equipment you want,” says Boksem. “The idea is that you do your test in the lab or make a part on the production floor and either take the data with you to analyze in the office or analyze it in real-time via the local PC network. We are aiming not just for processes like welding and infusion, but also for inline processes such as pultrusion or prepreg production, to enable monitoring the resin’s material state and content within the composite product.”
Twenco is also preparing for a move to the city of Hengelo, which is closer to the University of Enschede, enabling more students to work with the company. “For now, we are still manufacturing our own electronics and printed circuit boards in-house,” says Boksem. “But, as we prepare for serial production, we will begin outsourcing these and other components. And we will continue teaming with technical partners and looking for new investment partners to improve our technology.”


Related Content

ZeroAvia advances to certify ZA600 in 2025, launch ZA2000 with liquid hydrogen in 2027
Lightweight composite tanks are key to ZeroAvia’s vision for H2 aircraft to rival range and utility of jet fuel aviation.
Read More
TU Munich develops cuboidal conformable tanks using carbon fiber composites for increased hydrogen storage
Flat tank enabling standard platform for BEV and FCEV uses thermoplastic and thermoset composites, overwrapped skeleton design in pursuit of 25% more H2 storage.
Read More
Infinite Composites: Type V tanks for space, hydrogen, automotive and more
After a decade of proving its linerless, weight-saving composite tanks with NASA and more than 30 aerospace companies, this CryoSphere pioneer is scaling for growth in commercial space and sustainable transportation on Earth.
Read More
Ford Mustang Dark Horse features Carbon Revolution carbon fiber wheels
The 19-inch, five-spoke Dark Horse wheels feature signature blue carbon fiber detailing, keeping with the blue accents throughout the vehicle’s interior and exterior.
Read MoreRead Next

CW’s 2024 Top Shops survey offers new approach to benchmarking
Respondents that complete the survey by April 30, 2024, have the chance to be recognized as an honoree.
Read More
Composites end markets: Energy (2024)
Composites are used widely in oil/gas, wind and other renewable energy applications. Despite market challenges, growth potential and innovation for composites continue.
Read More
From the CW Archives: The tale of the thermoplastic cryotank
In 2006, guest columnist Bob Hartunian related the story of his efforts two decades prior, while at McDonnell Douglas, to develop a thermoplastic composite crytank for hydrogen storage. He learned a lot of lessons.
Read More