Composite Automotive Crush Structures
Tests that characterize, isolate and accurately measure energy absorption modes provide auto engineers the data they need to develop predictive CAE models.
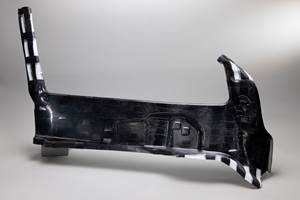
Metal crush structures have been used for years to absorb crash impact in automobiles and racecars. Although composite crush structures are now used and, in fact, offer better crash energy absorption (pound for pound) than many metallic crush structures, the automotive industry has lacked a method to accurately and quantitatively characterize composite crush structure behavior.
Testing is typically accomplished by axially crushing a round-cornered, square section tube made from the test material between the platens of a test machine in a controlled manner. A plug-type trigger (see Fig. 1, at left) is used to reduce initial crush load. Displacement and load data obtained in this type of test are used to calculate specific energy absorption (SEA), that is, the energy absorption capability per unit of mass. SEA is calculated by integrating the load-displacement curve to determine total energy absorbed and then dividing the total energy absorbed by the mass of the crushed portion of the tube.
Unfortunately, the test procedures used to characterize metal crush structures have been inadequate to the task of characterizing composite crush structure behavior because the latter involves a more complex set of phenomena. Where metal crush structures absorb crash impact energy primarily via plastic deformation (see Fig. 2, at left), composite crush structures exhibit several energy-absorbing modes:
Corner splitting. This process involves fracture of the fiber tows at the four tube corners. No fractured fiber tows are observed in the flat sides of the tube.
Delamination results when interlaminar shear loads are imposed as the composite is forced to bend over the fillet transition between the plug and the base plane of the plug trigger, which is perpendicular to the crush tube axis and crush direction. Because the fiber is significantly stronger in tension than the matrix, the matrix cracks and delamination occurs.
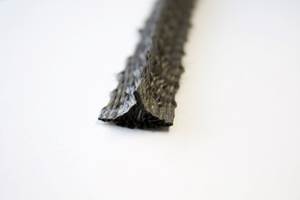
General matrix fracture also occurs as a result of combined bending and frictional forces as the composite tube sides are forced over the trigger fillets. Bending causes tensile force in the 0° direction on the inside of the tube (adjacent to the trigger) and compressive loading on the outside of the tube sufficient to cause widespread matrix fracture between fibers with little fiber damage in the tube sides. Friction energy absorption is inferred by observing the composite sliding over the crush trigger, which deforms the crush tube sides into a curved petal shape (as depicted in Fig. 3 at left).
Previously, researchers have speculated, with little agreement, about the relative energy absorption attributable to friction: One researcher considers it of “secondary importance,”2 while others suggest that absorption is as high as 50 percent3,4.
Experimental data for sliding friction has been lacking; therefore, a complete characterization of the mechanisms of composite energy absorption has, until recently, not been possible. This article describes simple experimental testing that was performed to isolate and measure energy absorption by these individual modes, including a method for isolating friction data.
Test Preparation
The work began with static and dynamic testing of composite crush tubes. Crush tubes and test coupons were made from triaxial braid (0, ±45) made with Fortafil 503 80K fiber (Toho Carbon Fibers Inc., Knoxville, Tenn.) in the axial direction and Grafil 112K for the off-axis reinforcement (Grafil Inc., Sacramento, Calif.). The braid was wet out with Hetron 922 vinyl ester resin supplied by Ashland Performance Materials, Composite Polymers (Dublin Ohio). Fiber content was 54.5 percent by weight (43 percent by volume). Laminate density was 1.419 g/cm3. Delsen Testing Laboratories (Glendale Calif.) characterized the mechanical properties of the laminate, using the coupons and the test method described in ASTM D 25846.
All static crush tube testing was performed at ambient room conditions in the Ford Innovation Center, formerly the Ford Scientific Research Laboratory (Dearborn, Mich.), using an MTS 810 servo-hydraulic material test system supplied by MTS Systems Corp. (Eden Prairie, Minn.). The MTS load frame has a 222-KN (50,000-lb) capacity and uses a 22.2-KN (5,000-lb) load cell. All specimen testing and data was controlled, recorded and analyzed through the use of MTS’s SinTech Testworks software. The crosshead speed was 0.0508 m/min.
Five carbon composite tubes were tested with the standard plug-type trigger, with a fillet radius of 6 mm/0.24 inch. The trigger for each composite tube was machined to fit inside the tube with a tolerance of 1 mm/0.04 inch or less. The upper end of the tube was contacted directly by the test fixture’s upper platen and was not constrained from movement transverse to the axis of the crush tube. The plug trigger was placed on the lower platen and also was unconstrained from transverse displacement. In all cases, no transverse displacement of either end of the crush tube was observed.
Dynamic testing was performed using the Test Machine for Automotive Crashworthiness (TMAC) located at the National Transportation Research Center, Oak Ridge National Laboratory (ORNL, Oakridge, Tenn.). ORNL and the Automotive Composites Consortium (ACC) collaborated to define specifications for a unique experimental apparatus that mitigates the shortcomings of existing equipment. MTS designed and built the TMAC, a servo-hydraulic test machine (see Fig 4, at right), uniquely capable of conducting controlled progressive crush tests at constant velocity in the intermediate velocity range (i.e., less than 5 m/s). Tests were conducted by ORNL’s Mike Starbuck and Rick Battiste.
Complex Crush Process
Quantifying energy absorption for each of the composite crush structure’s energy-absorbing modes is difficult because of the coupling among energy absorbing modes. The damage process zone advances intermittently as fibers are broken and fiber bundles fracture. Cracks advance to the next fiber or fiber bundle, and crack propagation is arrested until the forces due to crush loading become greater than the fiber strength. The pro-gressive local load maximums that occur during this process suggest that not all energy absorption modes are occurring simultaneously. That made it possible to devise tests that could isolate and measure the energy absorbed by each mode.
The minor energy absorption modes, corner splitting and delamination, were quantified using simple mechanical tests for quasi-static loading. (Dynamic energy absorption was not measured for corner splitting and delamination because reported strain rate effects9,10 suggest that the SEA would increase slightly and because the relative magnitude of corner splitting SEA and delamination SEA is small.) Tensile forces pull the composite tube apart at the corners as the tube is forced over the trigger because the trigger perimeter is effectively increased, thus loading the composite in tension similar to the tensile loading imposed during a tensile test of a flat coupon. In the case of the composite tube, this tensile loading is perpendicular (90°) to the tube axis. Energy absorption attributable to corner splitting at quasi-static compression, therefore, could be estimated using a standard tensile test on a coupon. The total corner-splitting energy absorption of the crush tube was calculated by multiplying the tube corner volume by the tensile strain energy density at fracture. The SEA attributable to corner-splitting energy was calculated by dividing total corner-splitting energy by the total mass of the crushed tube. It accounted for only 0.21 percent (0.063 J/gm) of the quasi-static SEA.
Calculation of the energy absorbed by delamination was determined using the Mode 2 critical strain energy release rate, GIIc, using the end notch flexure test7. Delamination accounted for 2.7 percent (0.84 J/gm).
The remaining 97 percent of the absorption (29.5 J/gm) was attributed to the combination of sliding friction and matrix damage due to bending.
Isolating and Quantifying Friction
In an attempt to separate the sliding friction-specific energy absorption SEA from the SEA attributable to matrix damage due to bending, a novel strip test fixture was designed by the author to isolate the friction component. The fixture was built in the Ford Innovation Center shop by Paul Ostrander and Gary Fleming, whose suggestions contributed significantly to its utility. Designed to mimic the damage process that occurs in the sides of a round-cornered square section crush tube when it is compressed using a plug trigger, the device permitted crushing of strips of composite under two fixture configurations, with and without sliding friction. The resulting load vs. deflection data then could be analyzed to calculate SEA attributable to sliding friction. Schematics of the test fixture and the standard tube crust test method can be seen in Fig. 5, p. 29.
The main working parts of the test fixture are four rollers mounted in low-friction ball bearings, which essentially eliminate sliding friction when the rollers rotate as the strip specimen is forced downward. Three guide rollers that support the test strip are of the same diameter: 12.7 mm/0.5 inch, to simplify design and fabrication, keep the test fixture compact and minimize the length of the strip specimen. Rollers A and C are aligned in the vertical direction. The roller second from the top, B, is adjustable horizontally to accommodate varying sample thickness. The lowest roller, D, is twice the diameter, 25.4 mm/1 inch, of the other three and, like roller B, is also horizontally adjustable. The larger diameter of roller D was chosen so that the range of curvature imposed on a strip test specimen could be varied over a large range by adjusting the horizontal position to simulate the curvature imposed on crush tubes when triggers with fillets of varying radii are used. Roller D is positioned to force the composite strip specimen to bend against the bottom guide roller, C, as the specimen is forced downward during testing.
Roller D can be used locked (unable to rotate) or unlocked (free to rotate). In locked mode, the strip specimen is forced to slide over roller D. When unlocked, sliding friction is removed from the damage process.
Test specimens – strips of braided carbon/vinyl ester composite (see schematic, Fig. 6, p. 31) – were machined from a four-ply, flat coupon 4 mm/0.16 inch thick by Nancy Johnson and Ruth Gusko of the GM Research Center (Detroit, Mich.). The strip dimensions are nominally 25.4 mm/1 inch wide and 200 mm/7.87 inches long. One end of each strip is beveled at a 45º angle to reduce the initial load peak and, thus, improve the structural stability of test. This bevel is usually present in composite crush tubes for the same reason.
Prior to testing, two hypotheses were developed: 1) that the energy absorption due to friction mechanisms is one of the primary modes of energy absorption for composite materials, and 2) that the difference in friction energy absorption under quasi-static loading vs. dynamic loading is the primary reason that the SEA of a composite varies, depending on loading speed.
Quasi-Static Strip Tests
Five strip specimens were quasi-statically (0.0508 m/min) loaded with roller D locked. Five additional strip specimens were tested quasi-statically at the same rate with roller D locked and the strips lubricated with zinc stearate (a dry film lubricant used to show the effect of altering the coefficient of sliding friction between the composite strips and fixed steel roller D). A third set of five strip specimens were quasi-statically (0.0508 m/min) loaded with roller D free to rotate during testing.
The load-displacement curve of each test was numerically integrated to calculate the absorbed energy. The latter was divided by the mass of the portion of the strip that was compressed to determine the SEA for each specimen.
The energy absorbed in the strip test with quasi-static loading and locked roller D was 19.3 J/gm. The SEA attributed to sliding friction and damage due to bending in a carbon composite crush tube was 29.5 J/gm. The difference of 10.2 J/gm can be attributed to the reduced damage observed in the strips. The appearance of the damaged strips does not show the degree of matrix damage seen in tubes.
It was necessary to make adjustments to the calculations to account for several limiting factors inherent in the test method. First, the composite strip is forced over a larger radius during the strip test compared with the tube crush tube. The strip test fixture is limited to bending the strip over a minimum radius of 6.3 mm, the radius of roller C. Second, the test specimens were twice the thickness of the composite crush tubes (4 mm/0.16 inch vs. 2 mm/0.08 inch), with twice the number of braided plies. Thinner specimens could not be tested with the strip test fixture due to test coupon structural instability. This meant that there were three delamination planes, compared to the one delamination plane of the carbon composite tubes. Thus, the SEA value for delamination for the strip test was 2.52 J/gm, or three times the delamination value for carbon composite tubes, 0.84 J/gm. This delamination SEA value of 2.52 J/gm was subtracted from the quasi-static load rate, locked roller D strip test SEA of 19.3 J/gm, giving a friction-plus-bending SEA value of 16.8 J/gm. The sliding friction and bending SEA values were then calculated.
The friction and bending SEA for the carbon composite tubes loaded quasi-statically, 29.5 J/gm, is divided by the friction-plus-bending damage SEA of 16.8 J/gm to obtain a ratio to quantitatively determine the friction and bending SEA for carbon composite tube crush. But important information obtained from the strip test described is the ratio of SEA due to sliding friction compared with SEA due to bending. Because friction is dependent upon the crush load, which is affected by the bending strength as well as the delamination and corner-splitting forces required for progressive crush, the ratio of sliding friction SEA to bending SEA is assumed to not vary between the strip test results and the tube crush results. Note that friction is determined to account for 10.6 J/gm or 34.8 percent of the energy absorbed when the carbon composite tubes are crushed at the quasi-static rate.
Dynamic Strip Tests
With Roller D locked, five strip specimens were tested dynamically at 2.0 m/sec, and three specimens were tested at 0.5 m/sec. There was no significant difference in the SEA of strips tested at 2.0 m/sec and 0.5 m/sec (15.5 J/gm vs. 15.4 J/gm).
Roller D then was locked and specimens were loaded at 2.0 m/sec for the next set of five strip specimens. However, these five strips were coated with zinc stearate to reduce sliding friction, resulting in a reduction in SEA of 23.8 percent compared with quasi-static loading (14.7 J/gm vs. 19.3 J/gm of case 1; see the strip test results summary in Fig. 7). However, when tested dynamically at 2.0 m/sec, the reduction in SEA for the lubricated strips was only 8.4 percent compared with the nonlubricated test strips (14.1 J/gm of case 5 vs. 15.4 J/gm of case 4).
In dynamic strip tests, with roller D free to rotate, there was little difference observed in the SEA between quasi-static loading (13.3 J/gm of case 3) and the dynamic load rate of 0.5 m/sec (13.3 J/gm of case 8). There was only a slight difference in SEA when the dynamic load rate was 2.0 m/sec (13.0 J/gm, case 6).
The dynamic crush energy adjustment for strips and crush tubes was made in a similar manner. The energy absorption due to bending was essentially un-changed (10.8 J/gm vs. 10.4 J/gm). Dynamic energy absorption due to sliding friction decreased significantly: 4.26 J/gm vs. 10.6 J/gm for quasi-static loading. Compare this 6.34 J/gm reduction in SEA, due to sliding friction, with the overall 6.6 J/gm reduction in composite tube crush SEA (from 30.4 J/gm for quasi-static load rate to 23.8 J/gm for dynamic load rate). For this composite system, then, nearly all of the SEA reduction when the load rate changes from quasi-static to dynamic is attributable to sliding friction.
Strip Test Results
The second hypothesis, therefore, proved accurate. We observed that matrix damage due to bending did not change significantly when loaded dynamically compared with the quasi-static result. Sliding-friction SEA, however, did show significant decrease when loaded dynamically vs. the quasi-static result and, therefore, accounts for nearly all of the difference in SEA between dynamic and quasi-static loading.
Under quasi-static compression, the SEA attributable to general matrix damage caused by bending was found to be 18.9 J/gm, or 62.2 percent of the total tube SEA. Under dynamic crush, the SEA attributable to matrix damage due to bending was found to be 18.6 J/gm, or 78.1 percent of the total tube SEA. The SEA attributable to sliding friction was found to be 10.6 J/gm, or 34.8 percent of the total tube SEA.
Under dynamic crush, the SEA attributable to sliding friction was found to be 4.3 J/gm, or 18.1 percent of the total SEA. The decrease in sliding-friction SEA of 6.3 J/gm accounted for nearly all of the decrease in tube SEA of 6.6 J/gm between dynamic crush and quasi-static compression. Sliding friction was concluded to be responsible for the decrease in overall tube SEA from quasi-static compression to dynamic crush.
The tests also yielded the following observations: 1) Sliding friction absorbs a significant amount of energy, at least in quasi-static cases; 2) altering the coefficient of friction of the composite tube surface can vary SEA; 3) energy absorption due to sliding friction can be separated from absorption due to damage formation; and 4) the decrease in SEA between dynamic and quasi-static loading is due almost entirely to the difference in sliding-friction SEA between dynamic loading and quasi-static loading.
The significance of this testing is that the physics of composite tube crush has been described quantitatively and a method of composite energy absorption measurement has been demonstrated. With this understanding, engineers will have increased opportunities to develop CAE methods to predict composite structures dynamic energy absorption.
This article adapted from papers first published at the 6th Annual SPE Automotive Composites Conference & Exhibition (ACCE), Society of Plastics Engineers (Troy Mich.), 2006.
References 1 Chadwick, M. M. and Caliskan, A. G., “Fracture Mechanisms Observed in Crush of Vinyl Ester-Glass Composite Tubes,” private communication, 1998
2 Farley, Gary, Jones, Robert, “Analogy for the Effect of Material and Geometrical Variables on Energy-Absorption Capability of Composite Tubes,” Journal of Composite Materials 26 (1992), pp. 78-89.
3 Thornton, P.H., “Energy Absorption in Composites,” Proc SEM Spring Conference on Experimental Mechanics, June 7-9, 1993, Dearborn, Mich.
4 Mamalis, A. G., Manolakos, D.E., Demosthenous, G. A., Ioannidis, “The static and dynamic axial collapse of fiberglass composite automotive frame rails,” Composite Structures 34 (1996), pp. 77-99.
5 ASTM D2584-02 “Standard Test Method for Ignition Loss of Cured Reinforced Resins.”
6 Delsen Test Report T 37674, July 23, 2003.
7 End Notch Flexure of Fiber Reinforced Composites, General Electric Specification No. 4013367-059, Issue 2.
8 Brimhall, T. J., “Measurement of Static and Dynamic Friction Energy Absorption in Carbon Vinyl Ester Composite,” SPE Advanced Composites Conference and Exposition, September 2006.
9 Weeks, C.A., Sun, C. T., “Modeling Non-Linear Rate-Dependent Behavior in Fiber-Reinforced Composites,” Composites Science and Technology 58 (1998), pp. 603-611, Elsevier Science Ltd., U.K.
10 Todo, M., Takahashi, K., Beguelin, P., Kausch, H. H., “Strain-rate dependence on the tensile fracture behavior of woven-cloth reinforced polyamide composites,” Composite Science and Technology 60 (2000), pp. 763-771, Elsevier Science Ltd., U.K.
Related Content
Materials & Processes: Fibers for composites
The structural properties of composite materials are derived primarily from the fiber reinforcement. Fiber types, their manufacture, their uses and the end-market applications in which they find most use are described.
Read MoreBiteam introduces 3D Noodle International AB spin-off for 3D fabric noodles
Biteam 3D’s third spin-off implements its proprietary 3D weaving technology to produce a variety of carbon, ceramic and other fiber 3D fabric noodle preforms.
Read MoreHighly tunable, woven lattice reinforcements target automotive structures
CAMX 2023: Startup Weav3D will be demonstrating its two collaborative automotive demonstrator parts and present two conference papers.
Read MorePlant tour: Albany Engineered Composites, Rochester, N.H., U.S.
Efficient, high-quality, well-controlled composites manufacturing at volume is the mantra for this 3D weaving specialist.
Read MoreRead Next
Composites end markets: Energy (2024)
Composites are used widely in oil/gas, wind and other renewable energy applications. Despite market challenges, growth potential and innovation for composites continue.
Read MoreCW’s 2024 Top Shops survey offers new approach to benchmarking
Respondents that complete the survey by April 30, 2024, have the chance to be recognized as an honoree.
Read MoreFrom the CW Archives: The tale of the thermoplastic cryotank
In 2006, guest columnist Bob Hartunian related the story of his efforts two decades prior, while at McDonnell Douglas, to develop a thermoplastic composite crytank for hydrogen storage. He learned a lot of lessons.
Read More
